For owners and the accountants who advise them

Every business has a story. Yours is in the books.

Open Mind Ledger reads your QuickBooks Online or TransactionFlow books and tells that story chapter by chapter, in plain English, with the math under every sentence.

5 days free · no card QuickBooks Online or TransactionFlow Fixed rules, not AI No extra QuickBooks calls
Story playing · Income
Same books, two readings

Charts show that something moved. A story says what happened.

Reading one · the tile dashboard
Gross margin
47.4%
9.3 pts vs last year
Materials per $1
19.6¢
8.5¢ (−30.2%)
Average ticket
$823
$201 (−19.6%)

Three red arrows. An owner reads this and worries all weekend.

Reading two · the same numbers, told
Told from the cause map · Jan–Aug 2026
The red arrow was good news. Margin gave up 9.3 points and gross profit more than doubled.

Jobs rose to 1,262 (+660) at a smaller average ticket of $823, and materials per sales dollar fell to 19.6¢. Gross profit reached $496,724, +$261,696 (+111.3%) on last year. Net income: $26,588, up $151,616.

Jobs by month →Materials per $1 →Cause map →

Every chapter is written by fixed rules from the synced books. Every sentence opens the table it came from.

One company, start to finish

The 2026 story of Coastline Mechanical, as the app tells it.

Coastline Mechanical is a sample company: real-shaped books, fictional names. Every screen on this page is the live product, full frame, not a drawing of it; the moving ones are recordings of it, unedited. Click any still to see it at full size. Jan–Aug 2026 against the same months in 2025, accrual basis.

CHAPTER 01

It opens on the headlines.

Nine sections, each with its own first sentence, in a fixed order. Press Play the story and the page walks through them, one headline at a time.

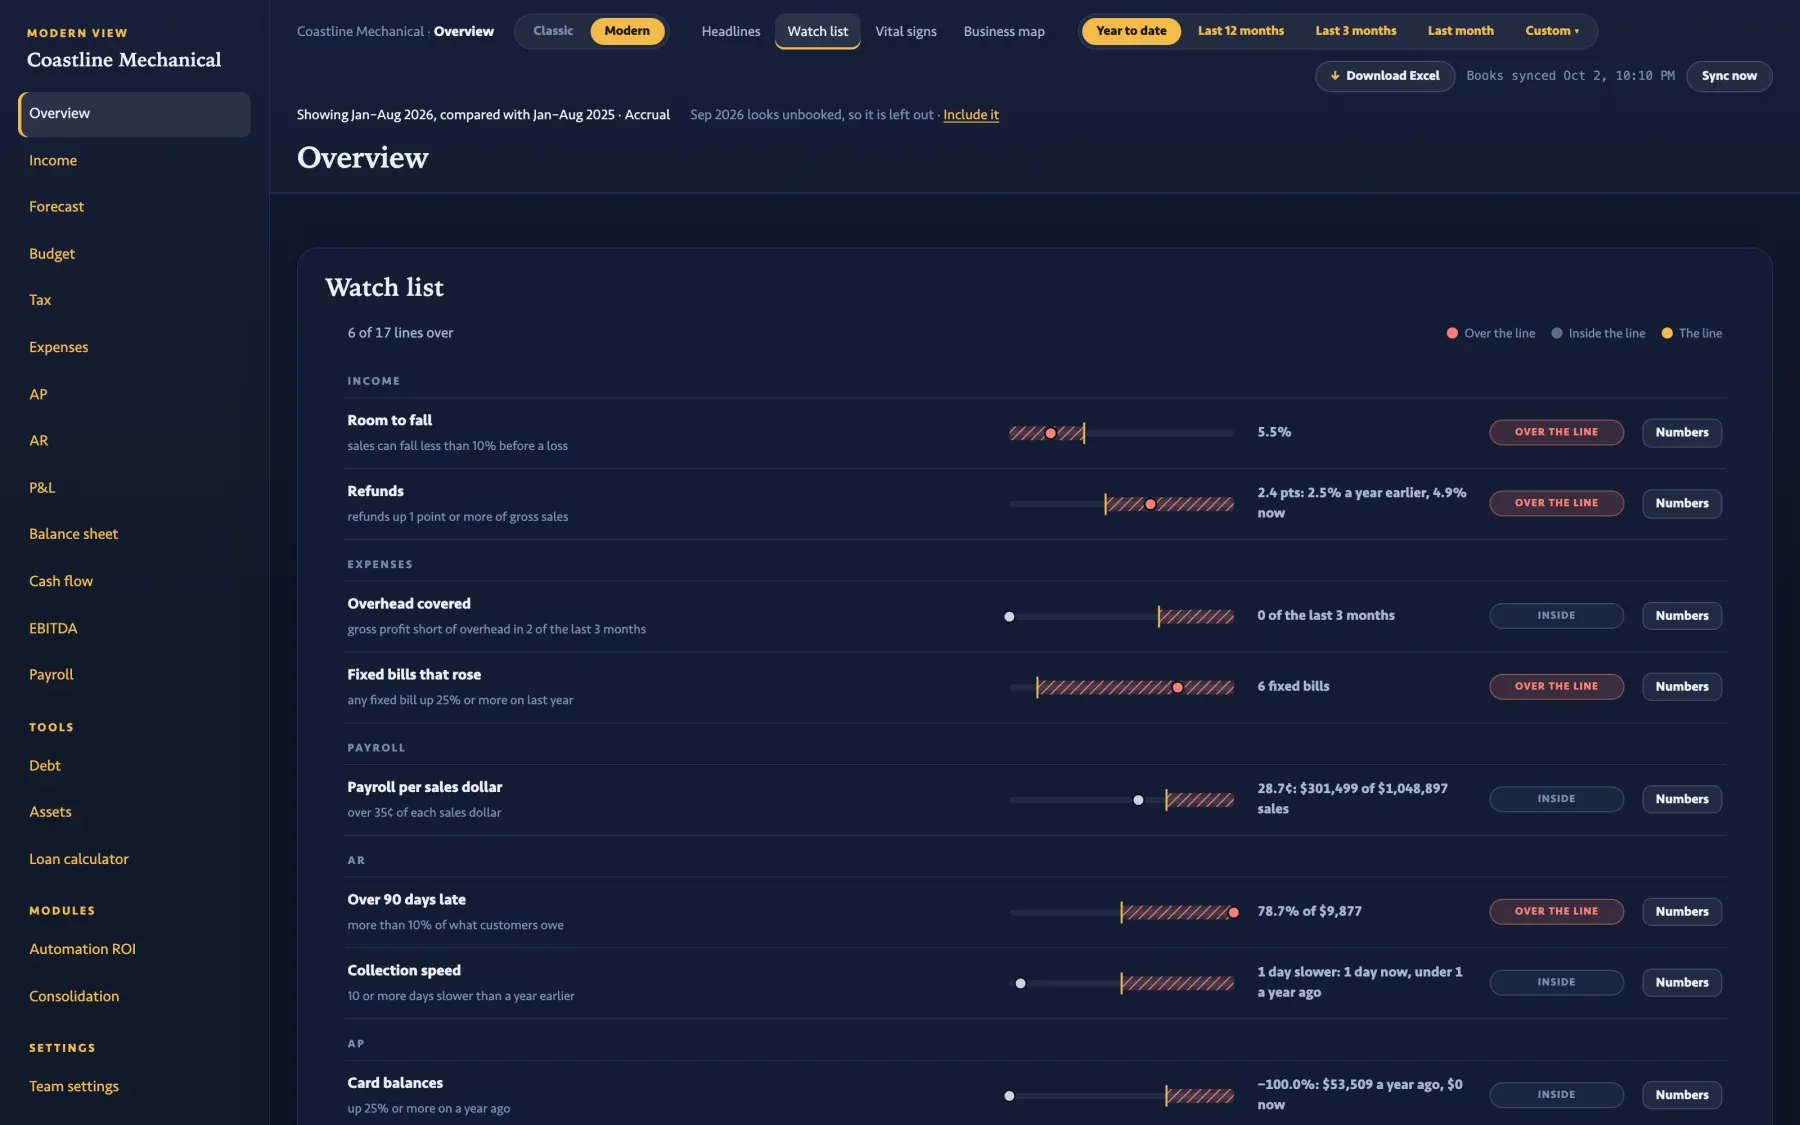
Under the headlines: a watch list of 17 fixed lines (6 crossed this month), twelve months of vital signs, and a map of the business drawn as money in, money out, and what is left.

Overview · Headlines   Sales +$431,992 (+70%). Costs +37.1%. Payroll +65.5% to $301,499, slower than sales.
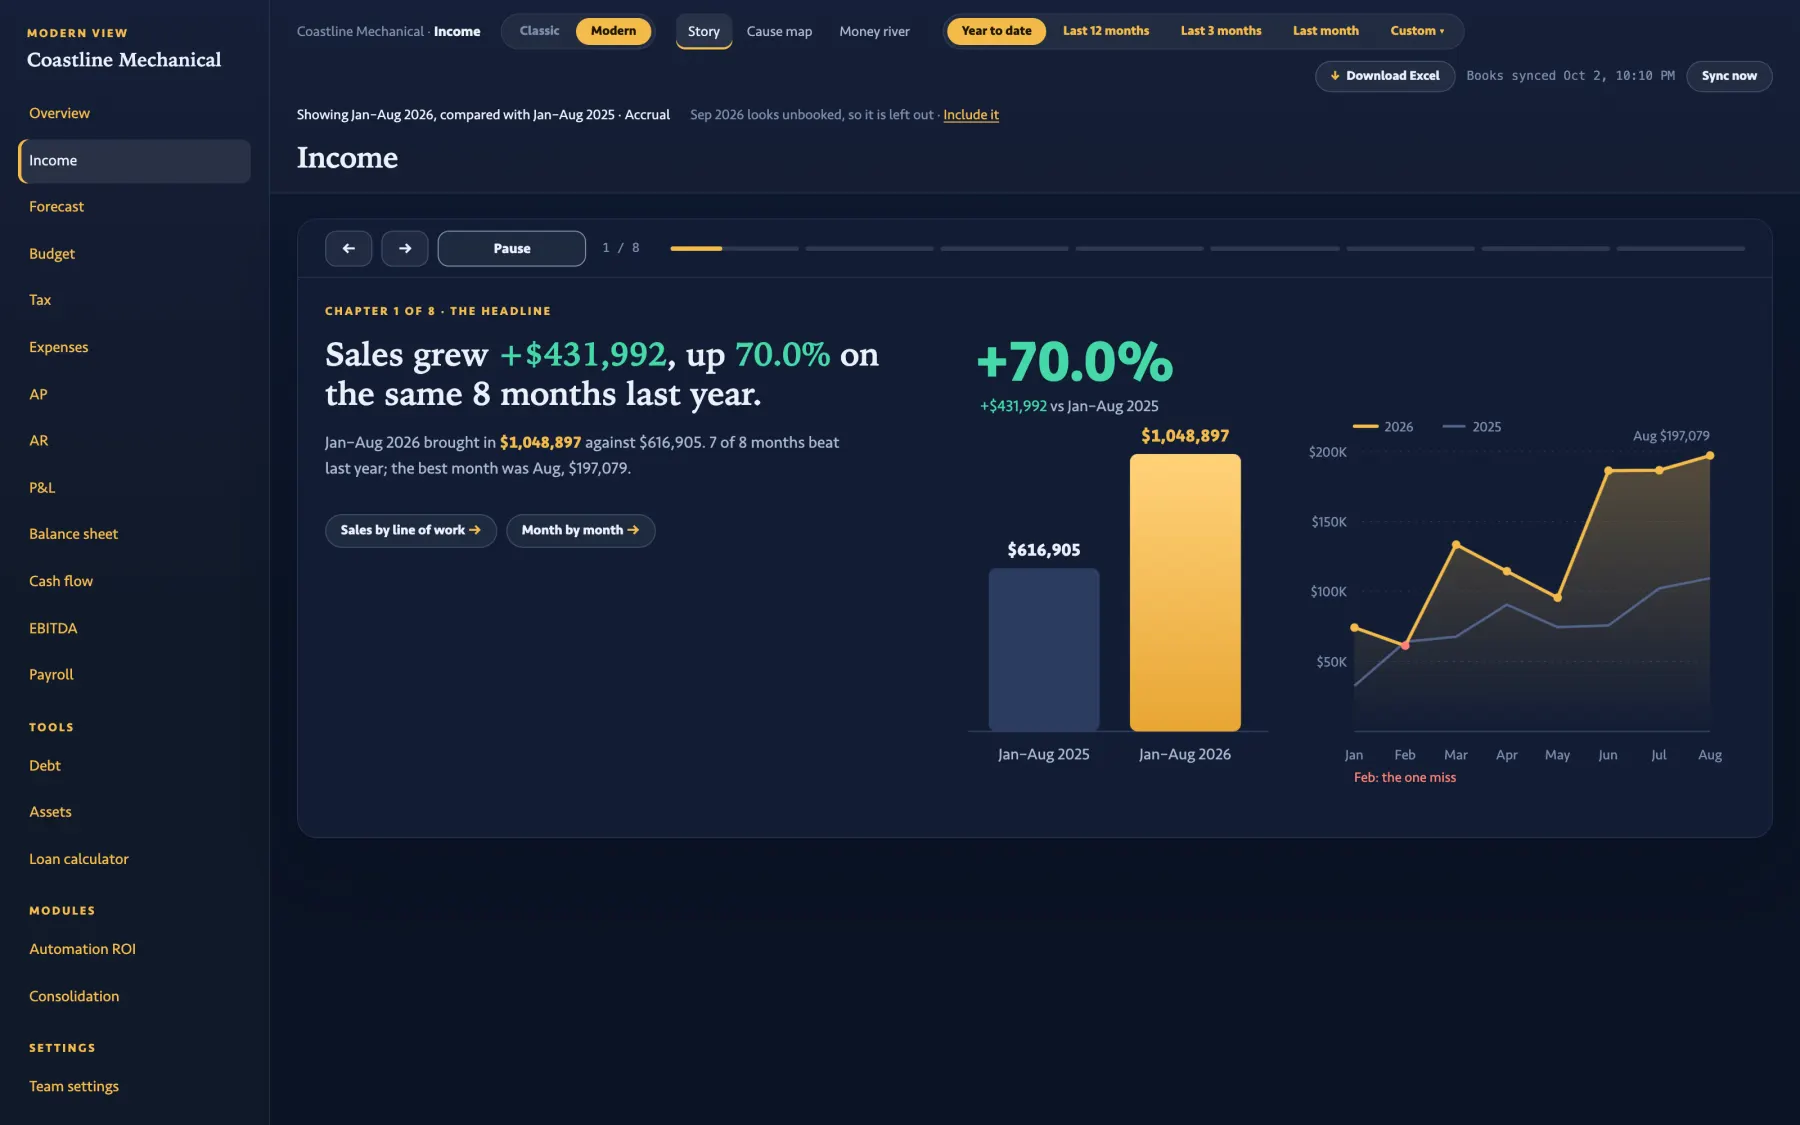
The Income Story mid-play: the Story bar advancing through the chapters.
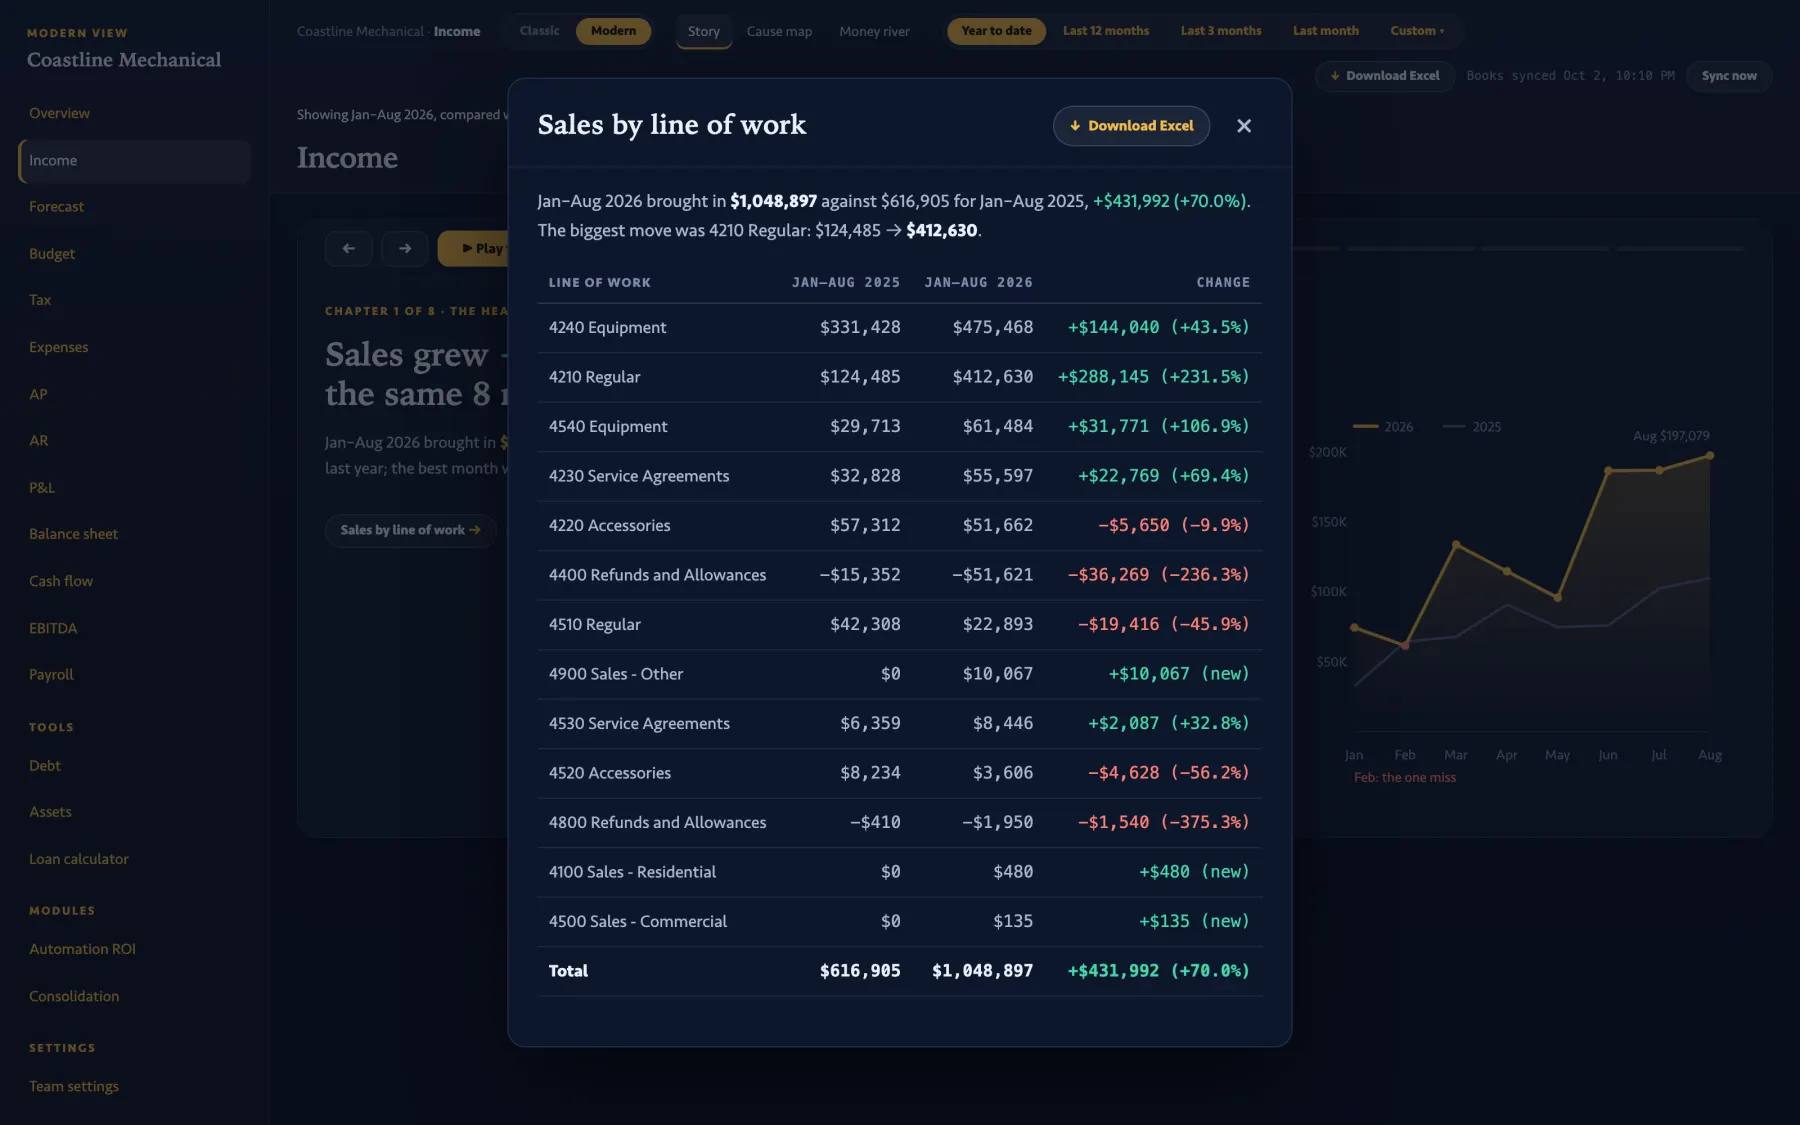
The Income Story with a centered detail window open: 'Sales by line of work', a table of each sales line this year against last year.
CHAPTER 02

What sold, and the table under the sentence.

Eight chapters on income, in the same order for every company. Each sentence prints its figures, and the month that missed is named, not hidden in an average.

Touch a chip and the detail window opens over the story with the rows that made the number. Download Excel sits on every section and every window.

CHAPTER 03

Pull a lever. Watch it reach net income.

The cause map draws the business as a tree: net income at the root, gross profit and overhead as branches, then sales, jobs, ticket size, materials per dollar, marketing per customer. Slide any lever and every number it touches lights up, all the way to the bottom line. Five stress tests sit under it: sales −10%, −20%, −30%, costs +5%, lose the top customer.

Income · Cause map   One fixed formula, the same on every company. No formula is fitted to the data; the math is printed under each lever.

CHAPTER 04

Where every $100 of sales went. Where every dollar of cash went.

Two rivers. The money river runs gross sales into cost of jobs, overhead, interest and what stayed as profit: $2.53 of every $100 this year, none last year. The cash river runs what the bank actually saw: $1,318,410 in, $1,193,452 out, the balance up $124,958. Switch years and the river re-draws on the same scale.

Income · Money river   switching years
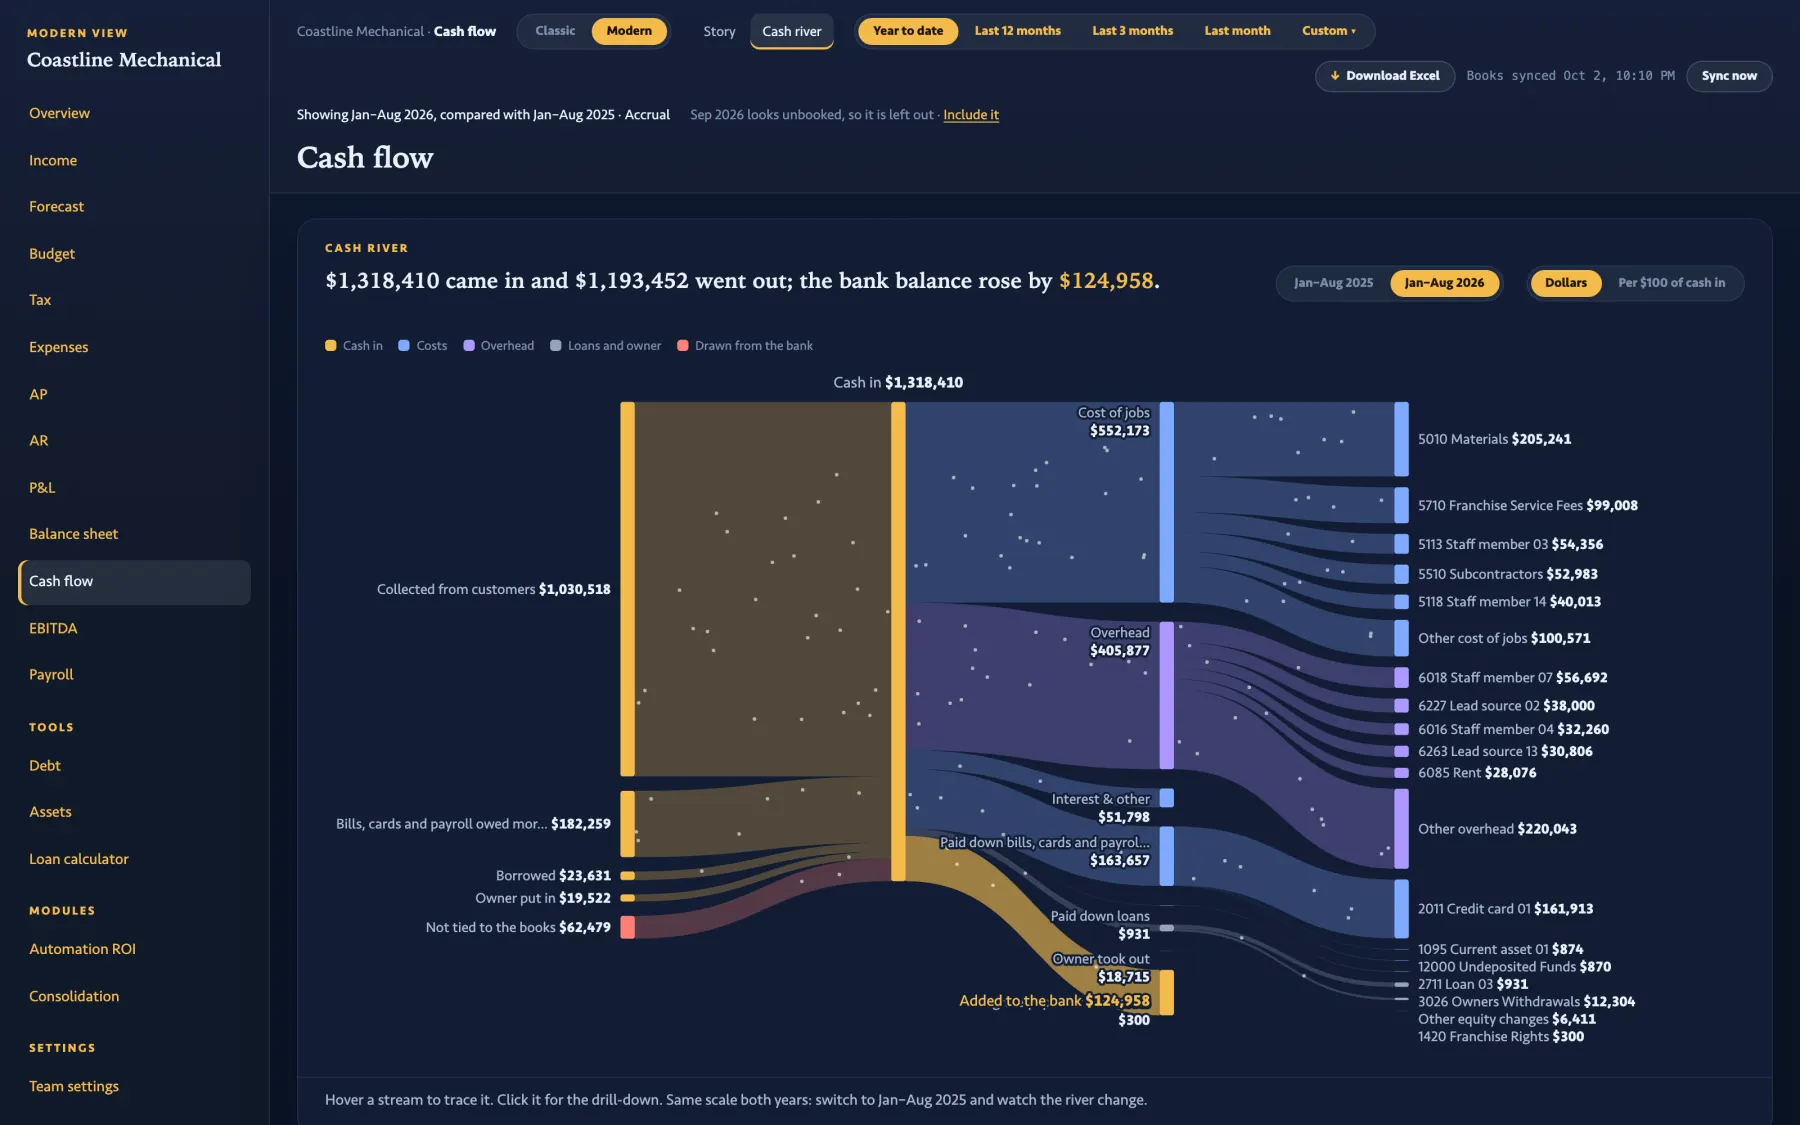
The Cash flow Cash river: $1,318,410 collected and borrowed on the left, costs, overhead, loan paydown and owner draws on the right, $124,958 added to the bank.

Cash flow · Cash river

CHAPTER 05

What it cost, and who it paid.

Costs grew 37.1% while sales grew 70%: each sales dollar carried 91.3¢ of cost, down from $1.13. Six chapters on expenses, then cost levers, a month grid, and a breakdown by group, vendor, class and location.

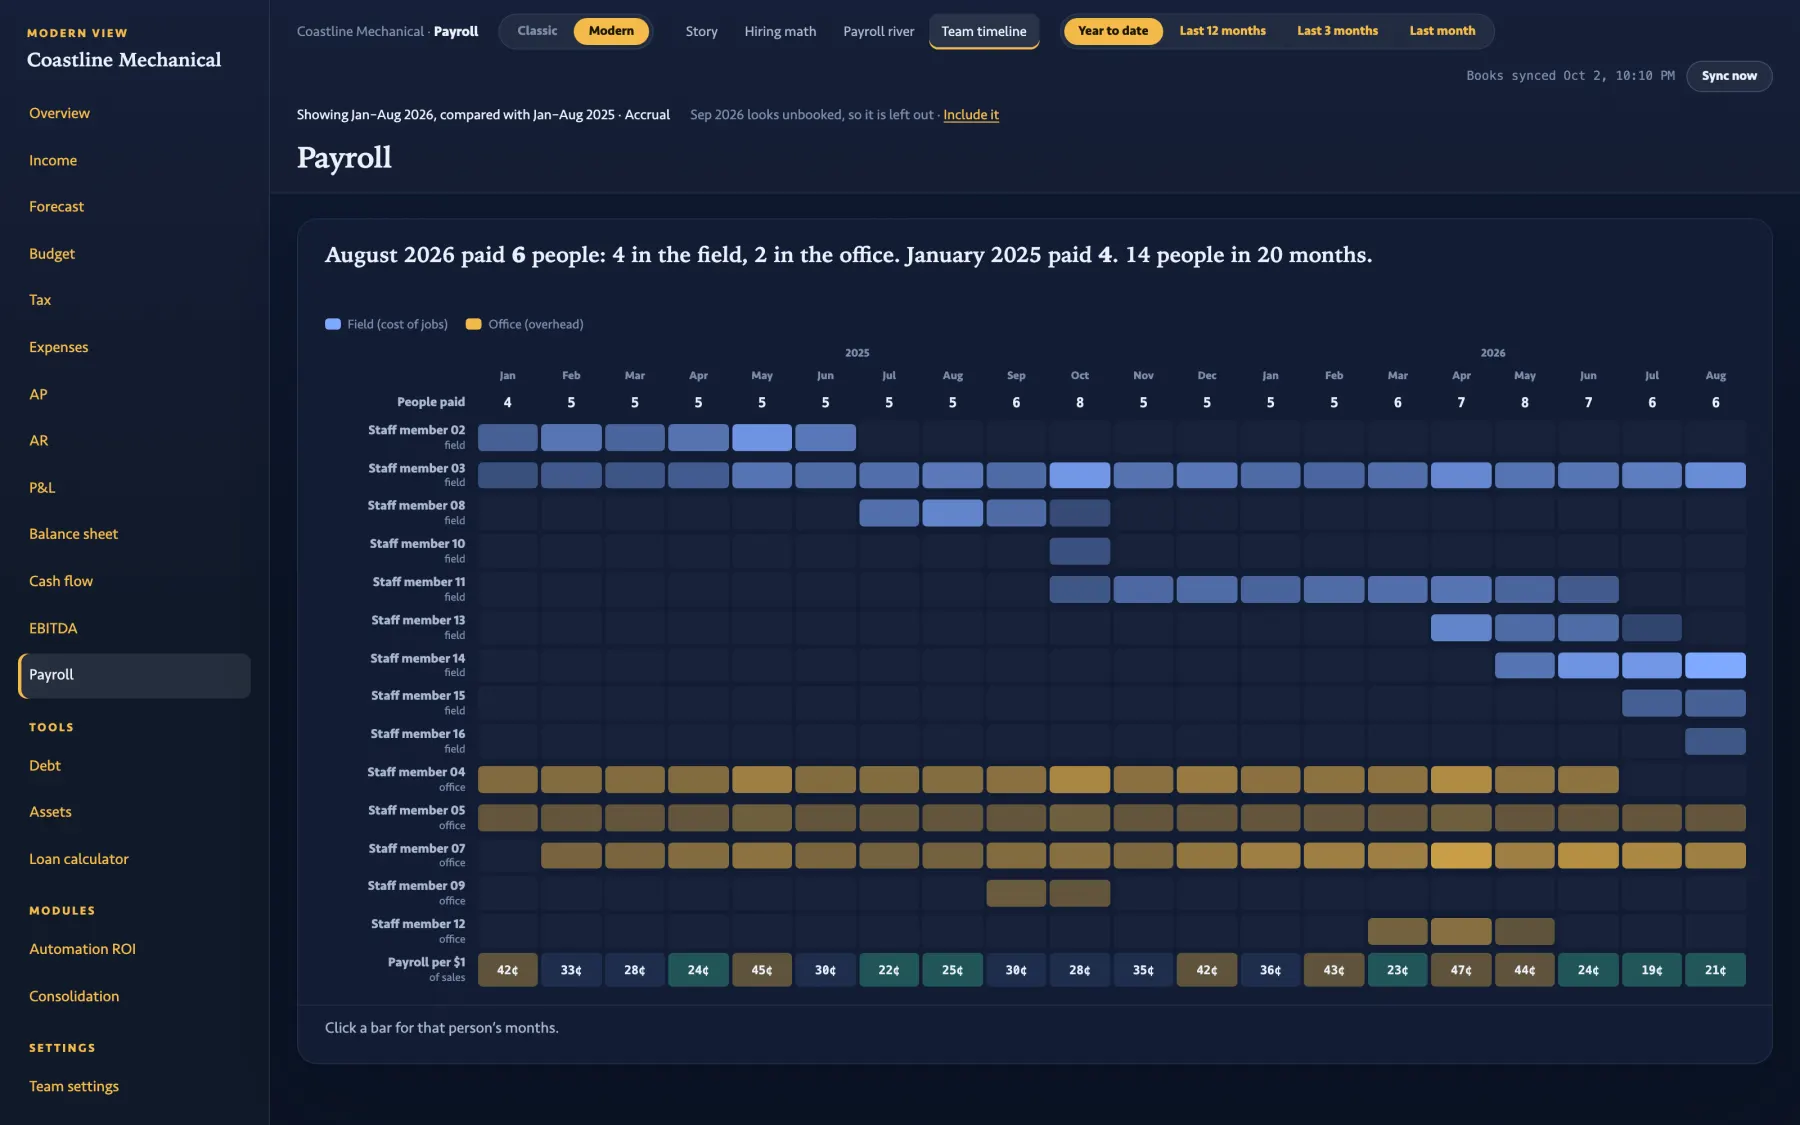
Payroll gets its own story and a team timeline: who was paid in which month, field against office, and payroll per sales dollar along the bottom, month by month.
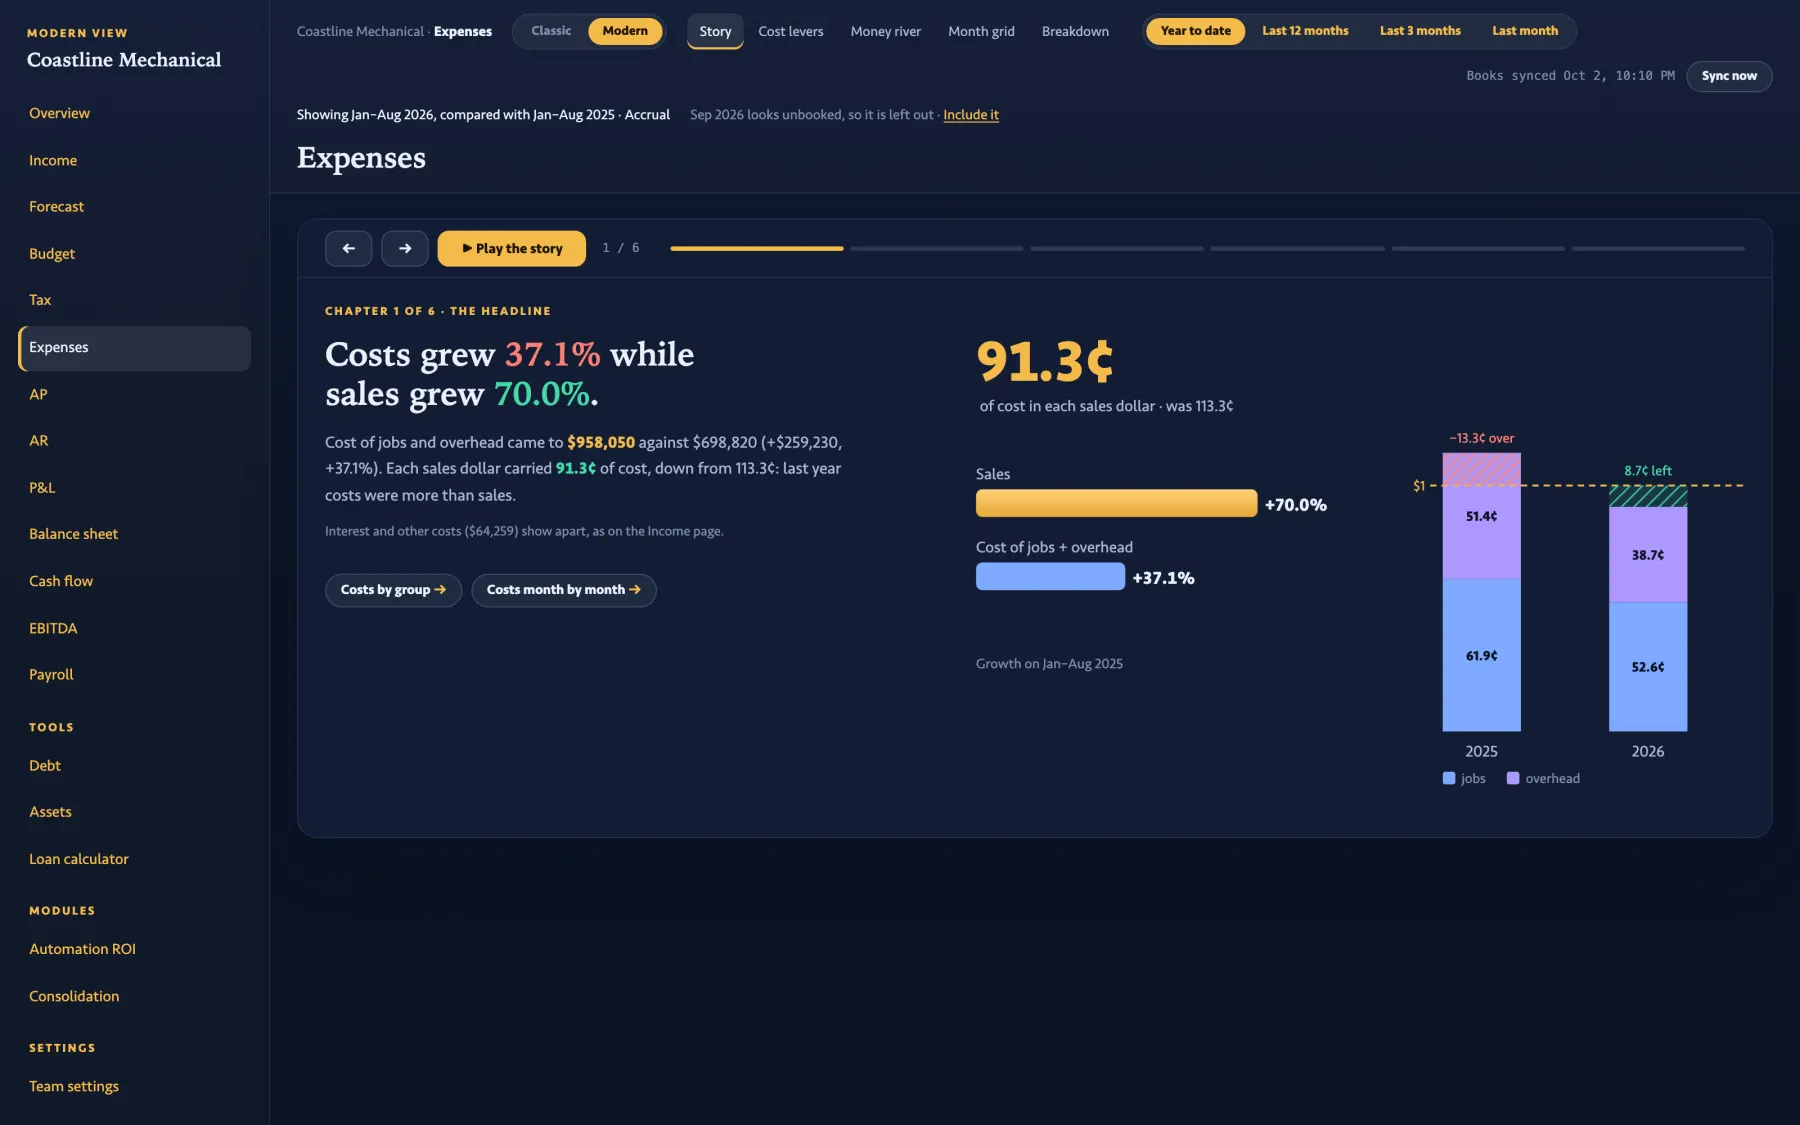
The Expenses Story: 'Costs grew 37.1% while sales grew 70.0%', 91.3¢ of cost in each sales dollar, with a stacked bar for 2025 and 2026.
The Payroll Team timeline: 14 people across 20 months, field in blue and office in gold, payroll per $1 of sales under each month.
CHAPTER 06

Who owes you. What you owe. What you own.

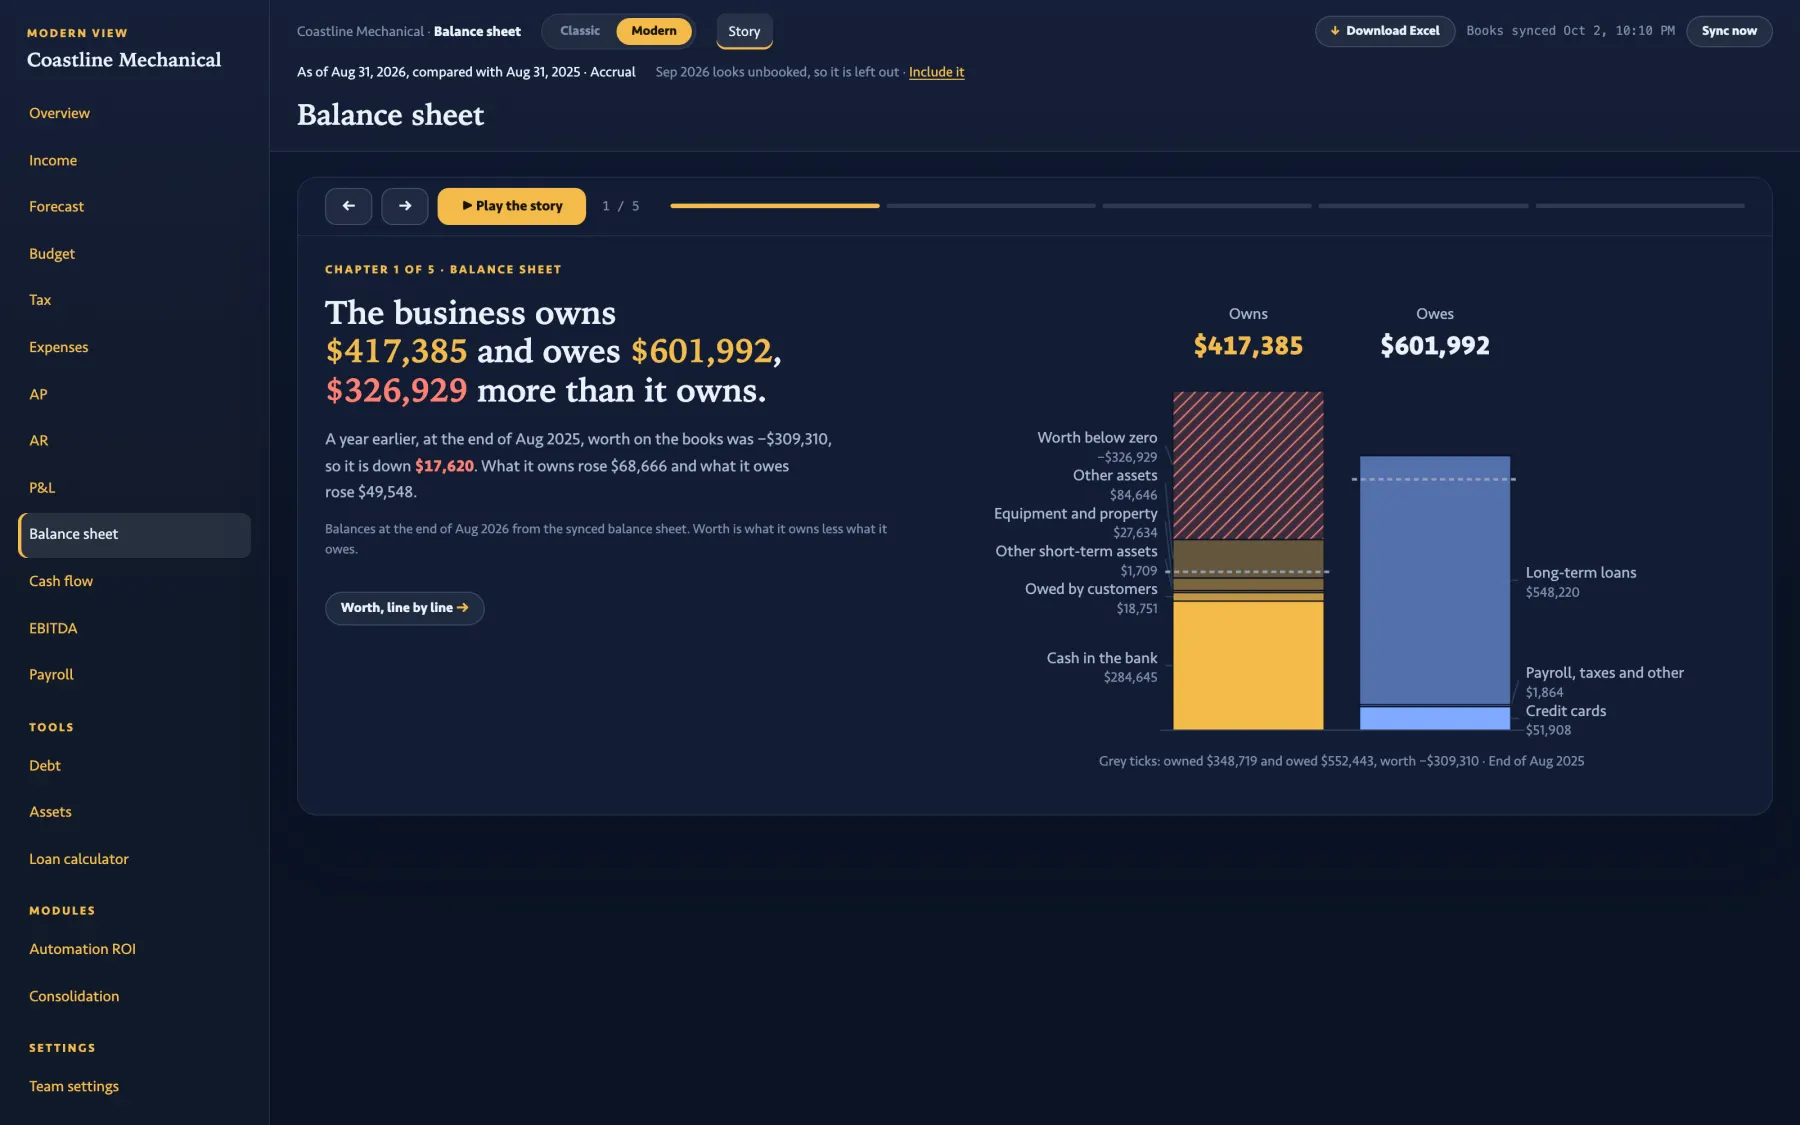
Receivables by customer and age, payables by vendor and due date, and the balance sheet read as what the business owns against what it owes. The aging maps come from the synced copy of the books, one cell per customer per bucket.
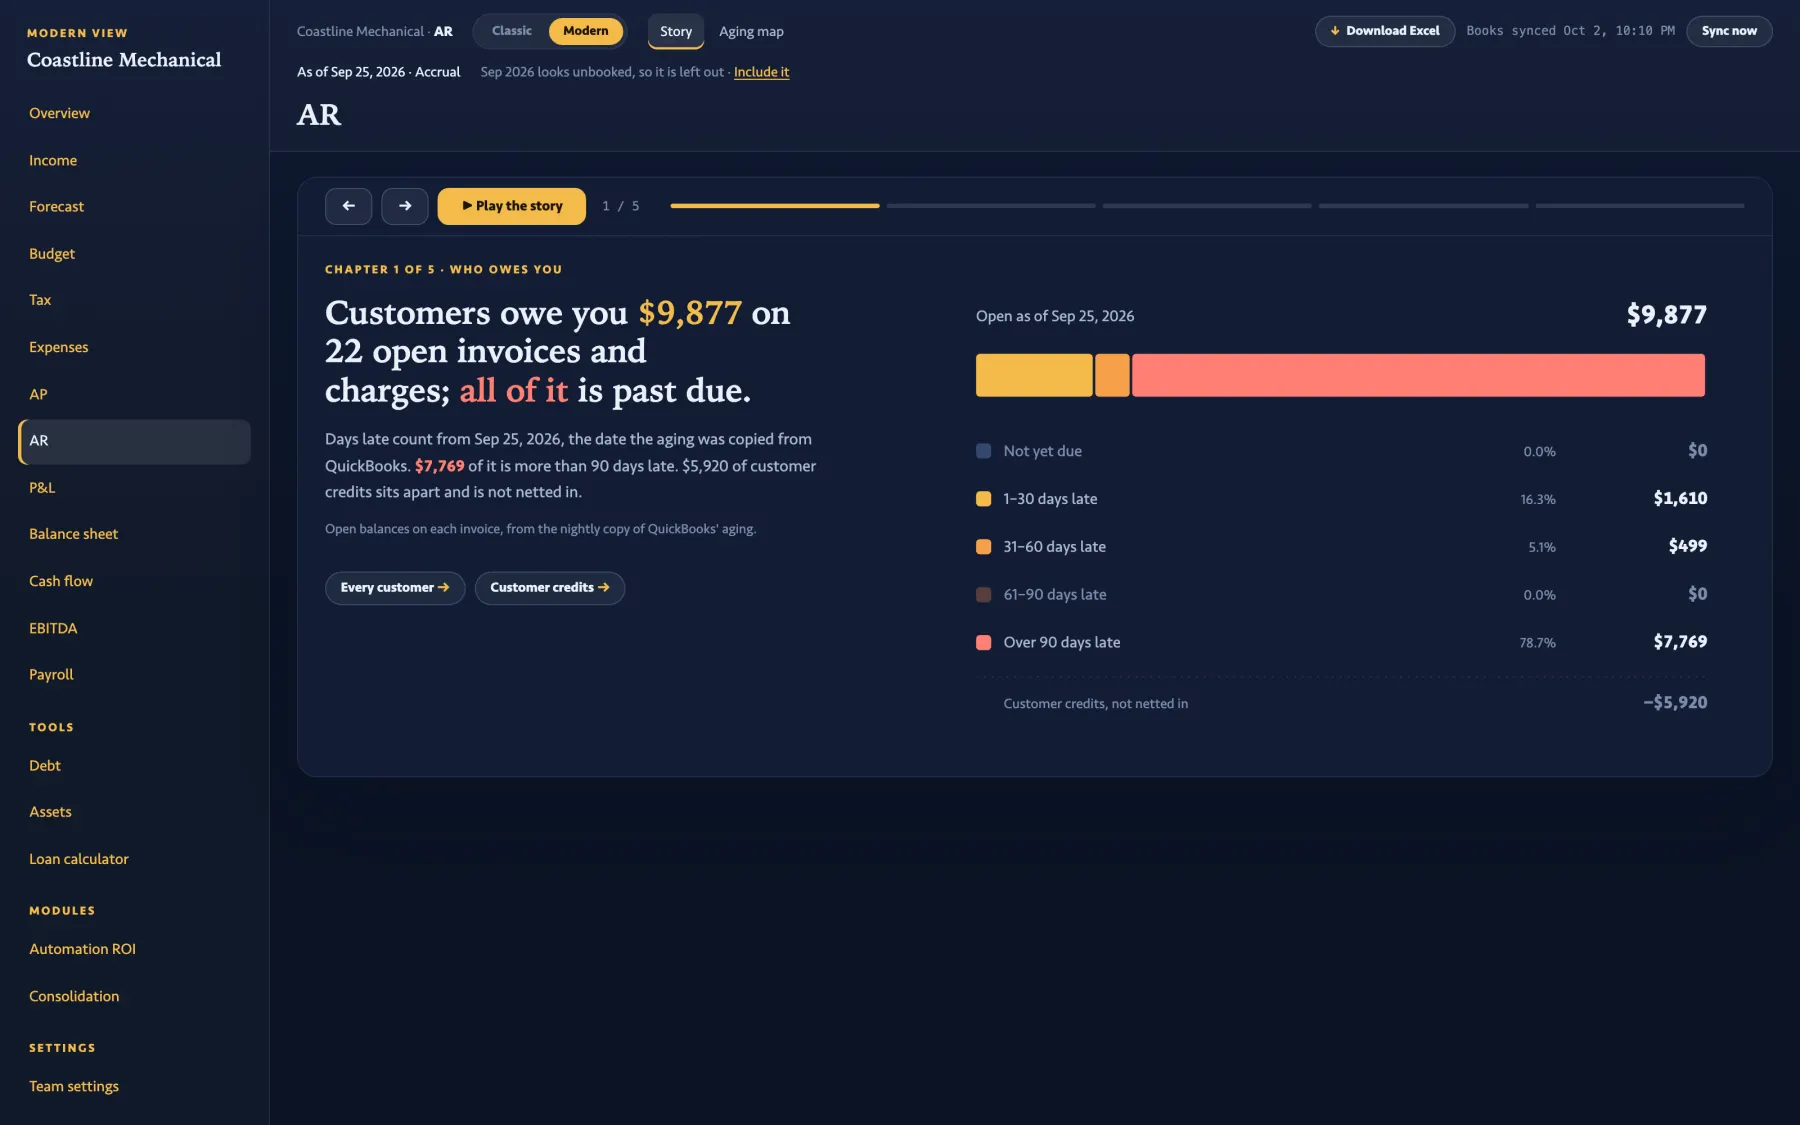
The AR Story: $9,877 on 22 open invoices, all past due.

AR · Story   $9,877 on 22 open invoices, all past due
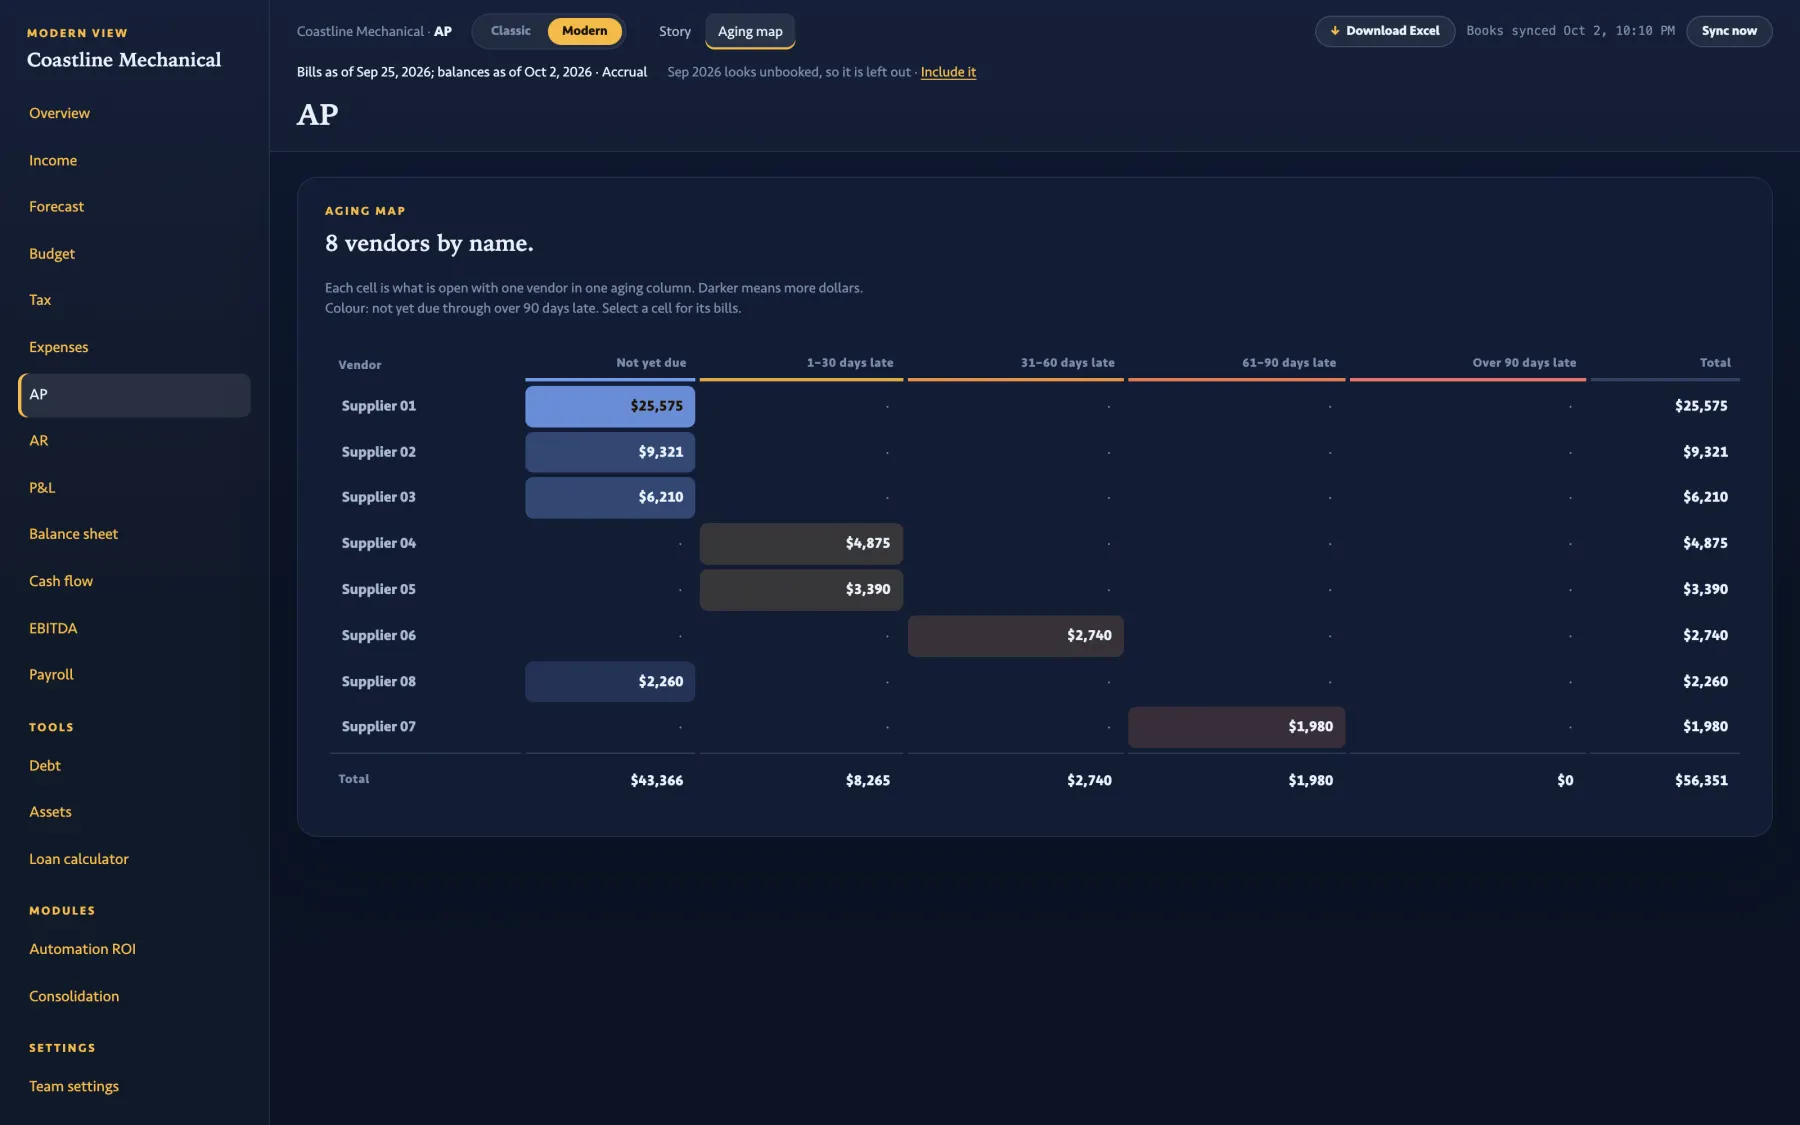
The AP Aging map: eight vendors in rows, five age buckets in columns.

AP · Aging map

The Balance sheet Story: what the business owns against what it owes, as of Aug 31, 2026.

Balance sheet · Story

CHAPTER 07

Where cash is heading, and what the business can carry.

Twelve months of month-end bank balance, drawn as a band sized from the forecast's own past misses on these books. The planner answers one line at a time, from dropdowns and an amount, never a chat box.

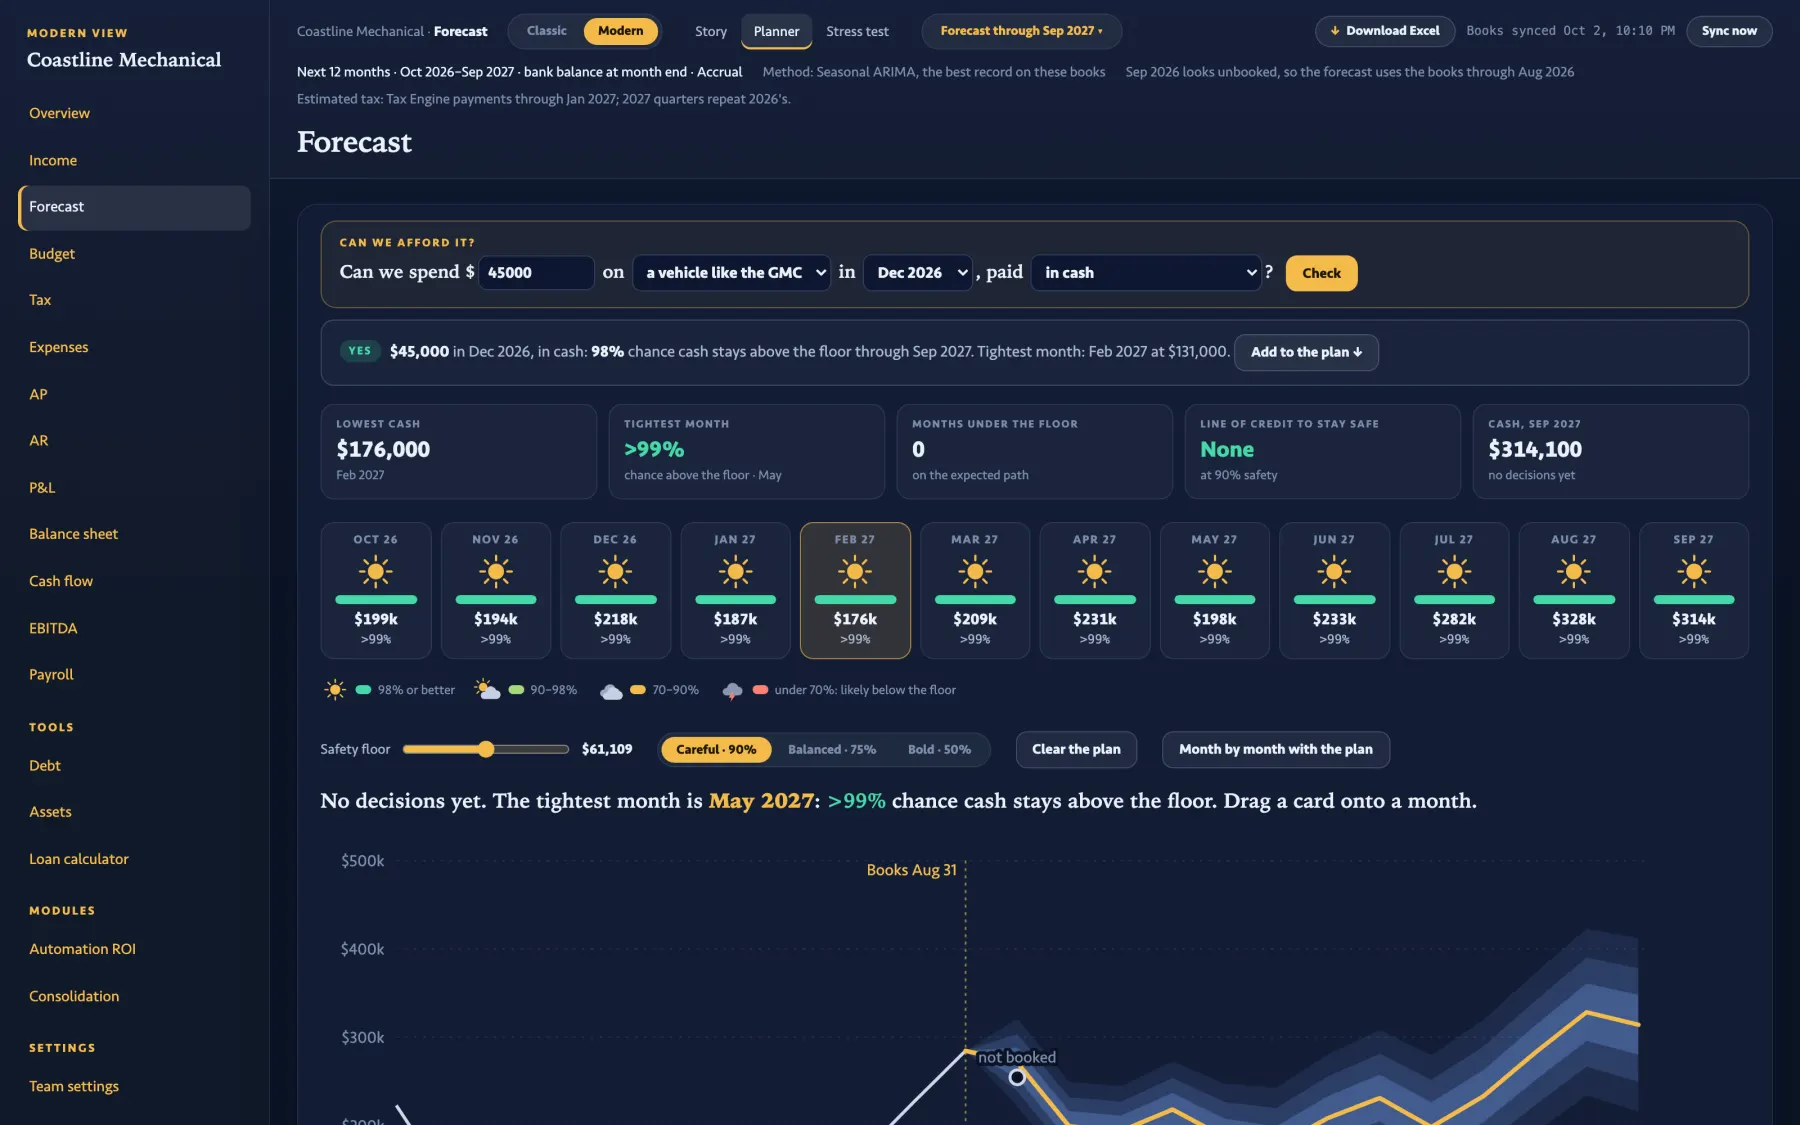
Can we spend $45,000 on a vehicle in Dec 2026, paid in cash?

Yes. 98% chance cash stays above the floor through Sep 2027. Tightest month: Feb 2027 at $131,000. One click adds it to the plan.

Then press a stress test. Recession: sales 25% below last year for twelve months. The chart re-draws, the low month prints, and the page states the fact: a $22,700 line of credit, or overhead cut 6% from October, gets through it. No verdict, no advice; the arithmetic is on screen.

The Forecast Planner: the 'Can we afford it?' line filled in with $45,000 on a vehicle in Dec 2026 in cash, the YES answer strip, twelve month tiles with chance-above-floor, and the fan chart.

Forecast · Planner   Lowest cash $176,000 in Feb 2027 · months under the floor: 0

Forecast · Stress test   Low $91,900 in May 2027 · bank hits $0: never

CHAPTER 08

What the owner will owe, on one receipt.

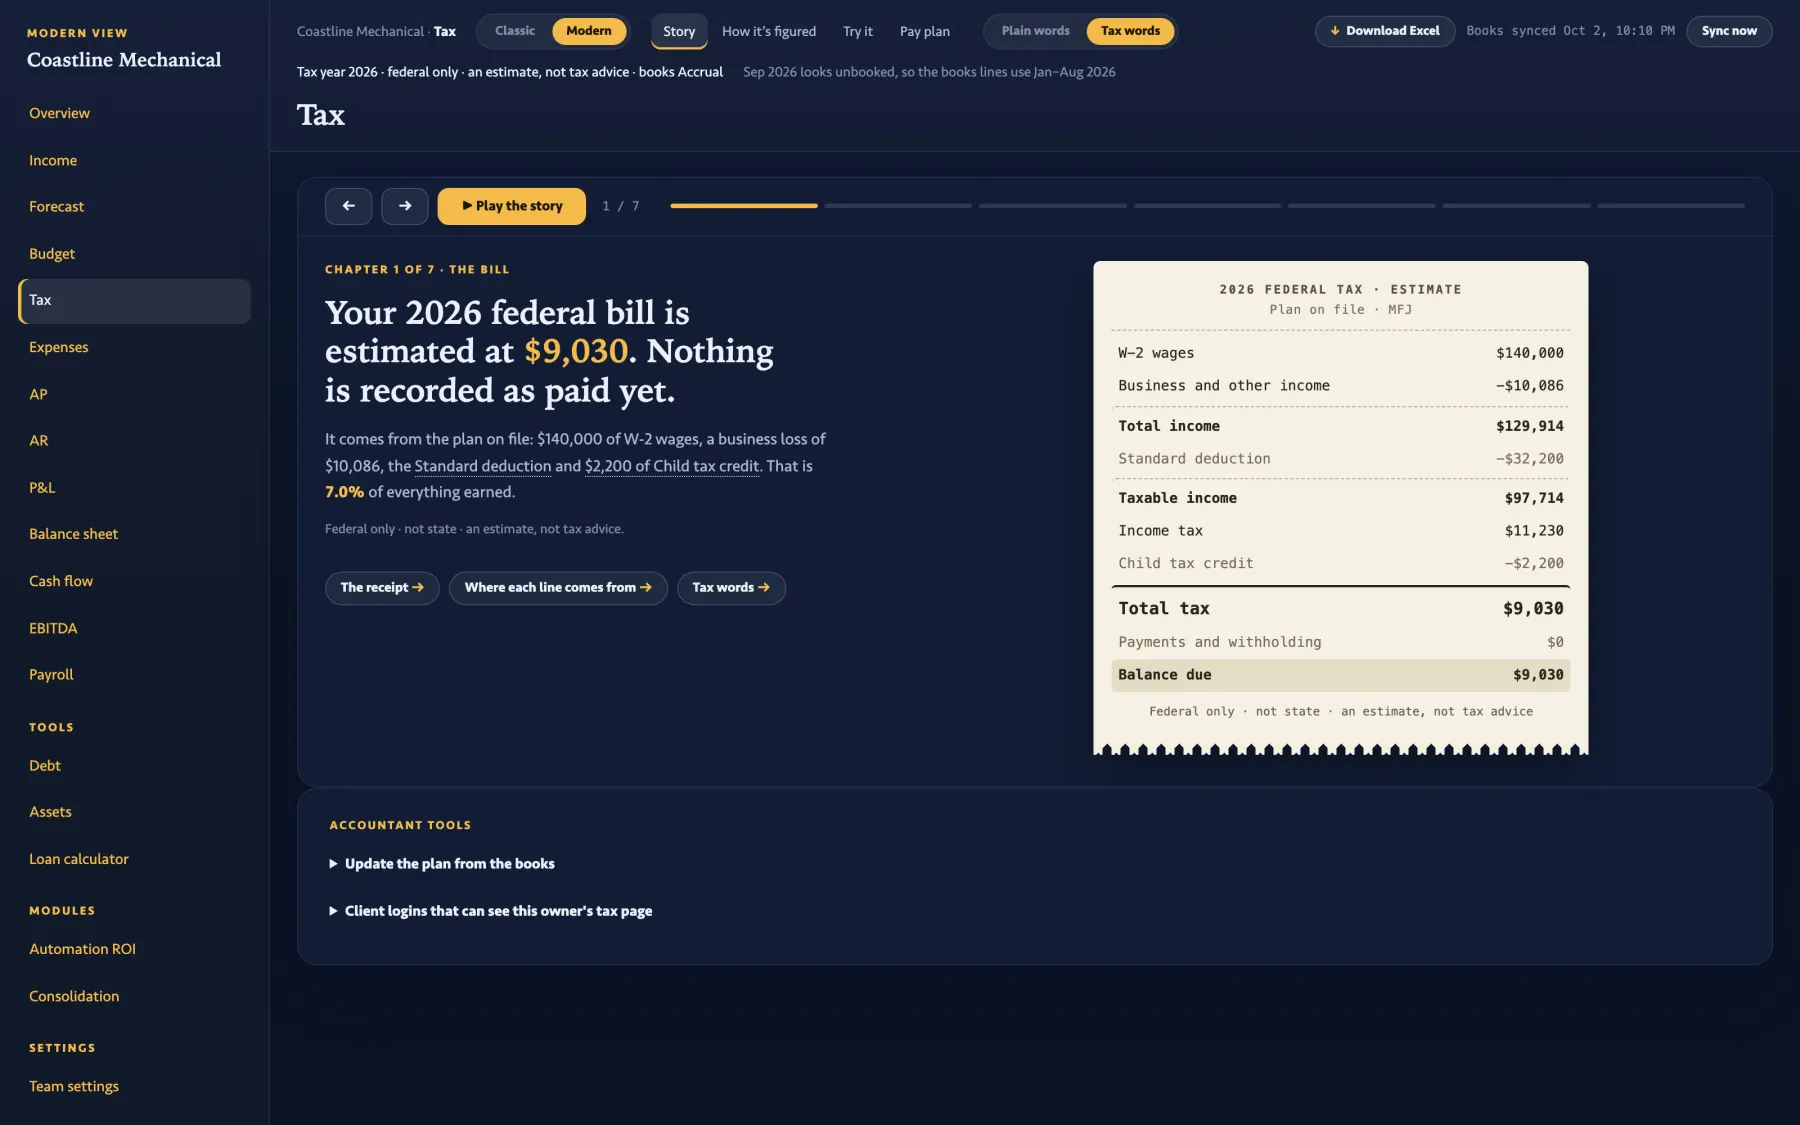
The 2026 federal estimate is $9,030, printed as a receipt: wages, business income, the standard deduction, the credit, the tax. Each line opens where it came from. Flip Plain words to Tax words and the same chapter speaks either language.

Then How it's figured, Try it with five levers, and a Pay plan. Federal only, an estimate, never tax advice.

The Tax Story: 'Your 2026 federal bill is estimated at $9,030. Nothing is recorded as paid yet', beside a receipt-style estimate with wages, business income, deduction, credit and balance due.

Tax · Story   Federal only · an estimate, not tax advice · figures from the tax engine

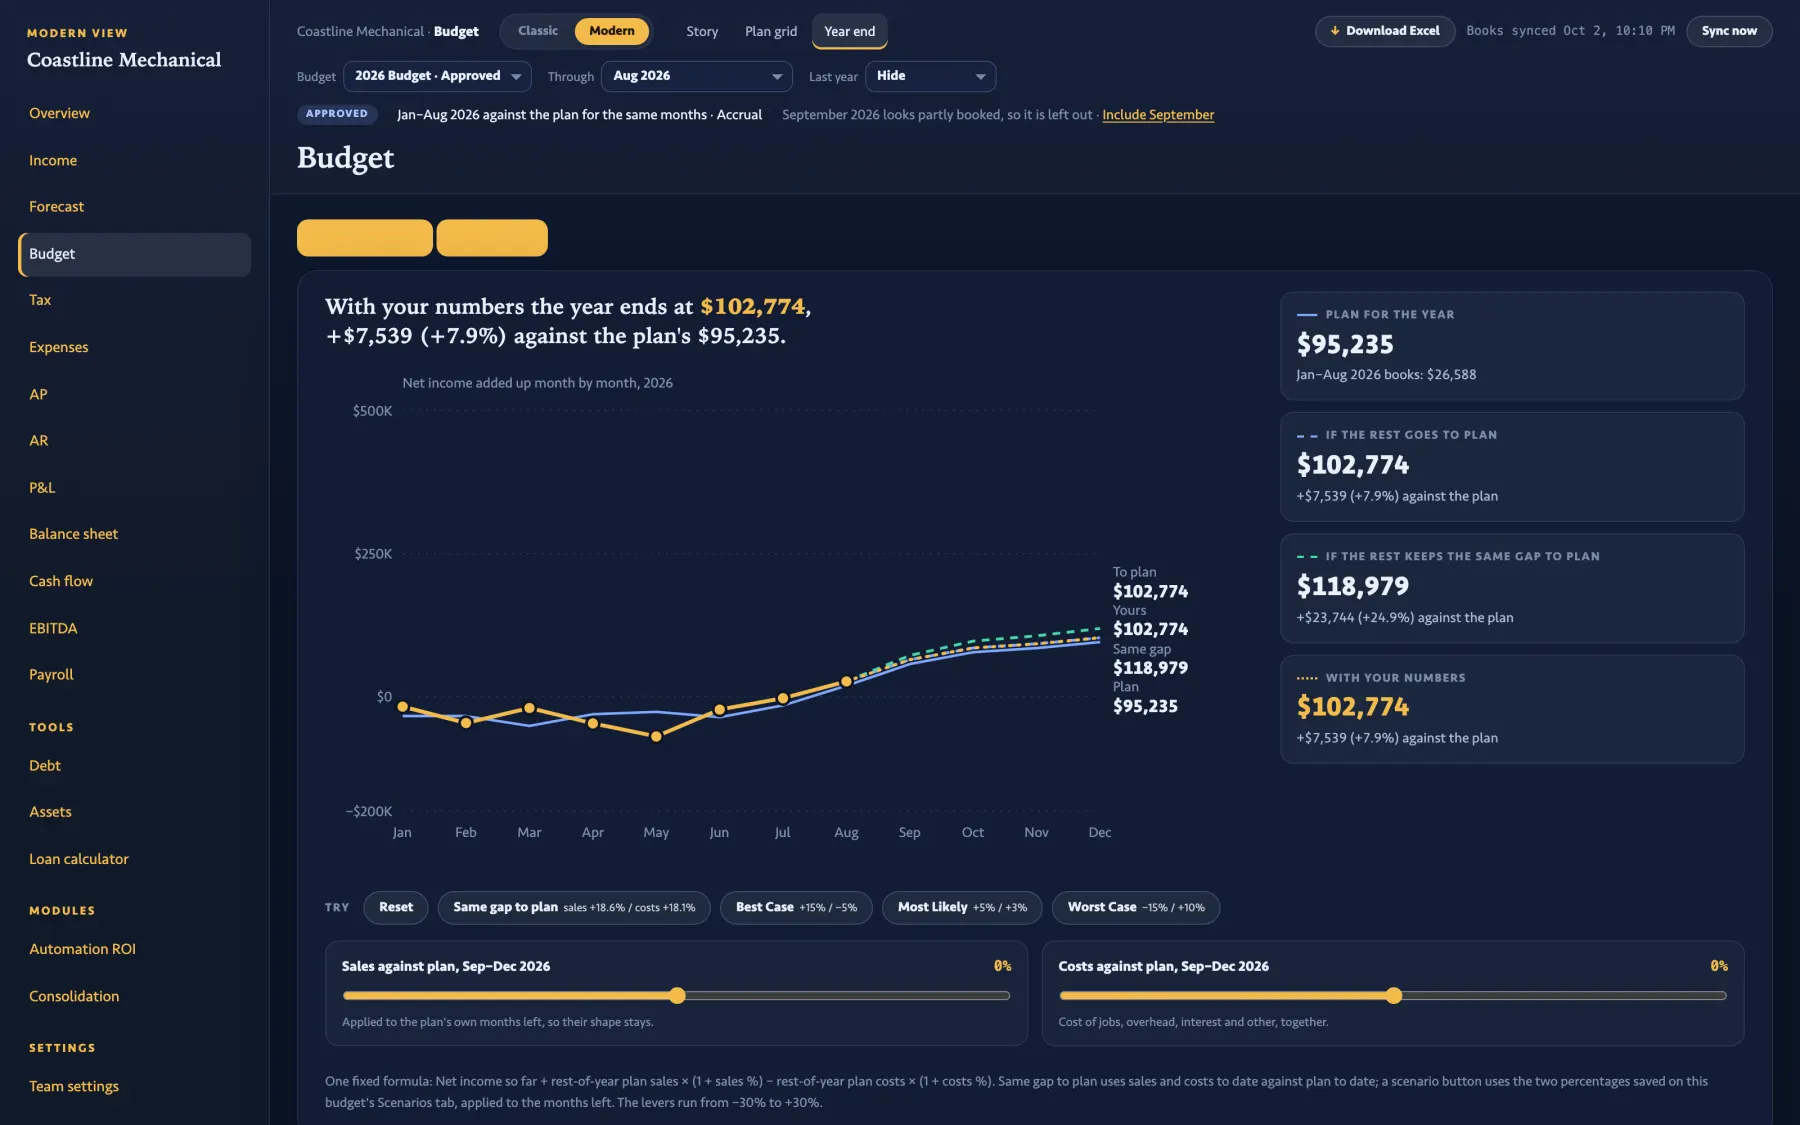
The Budget Year end page: where the year lands against the approved 2026 plan, with the stored scenarios.
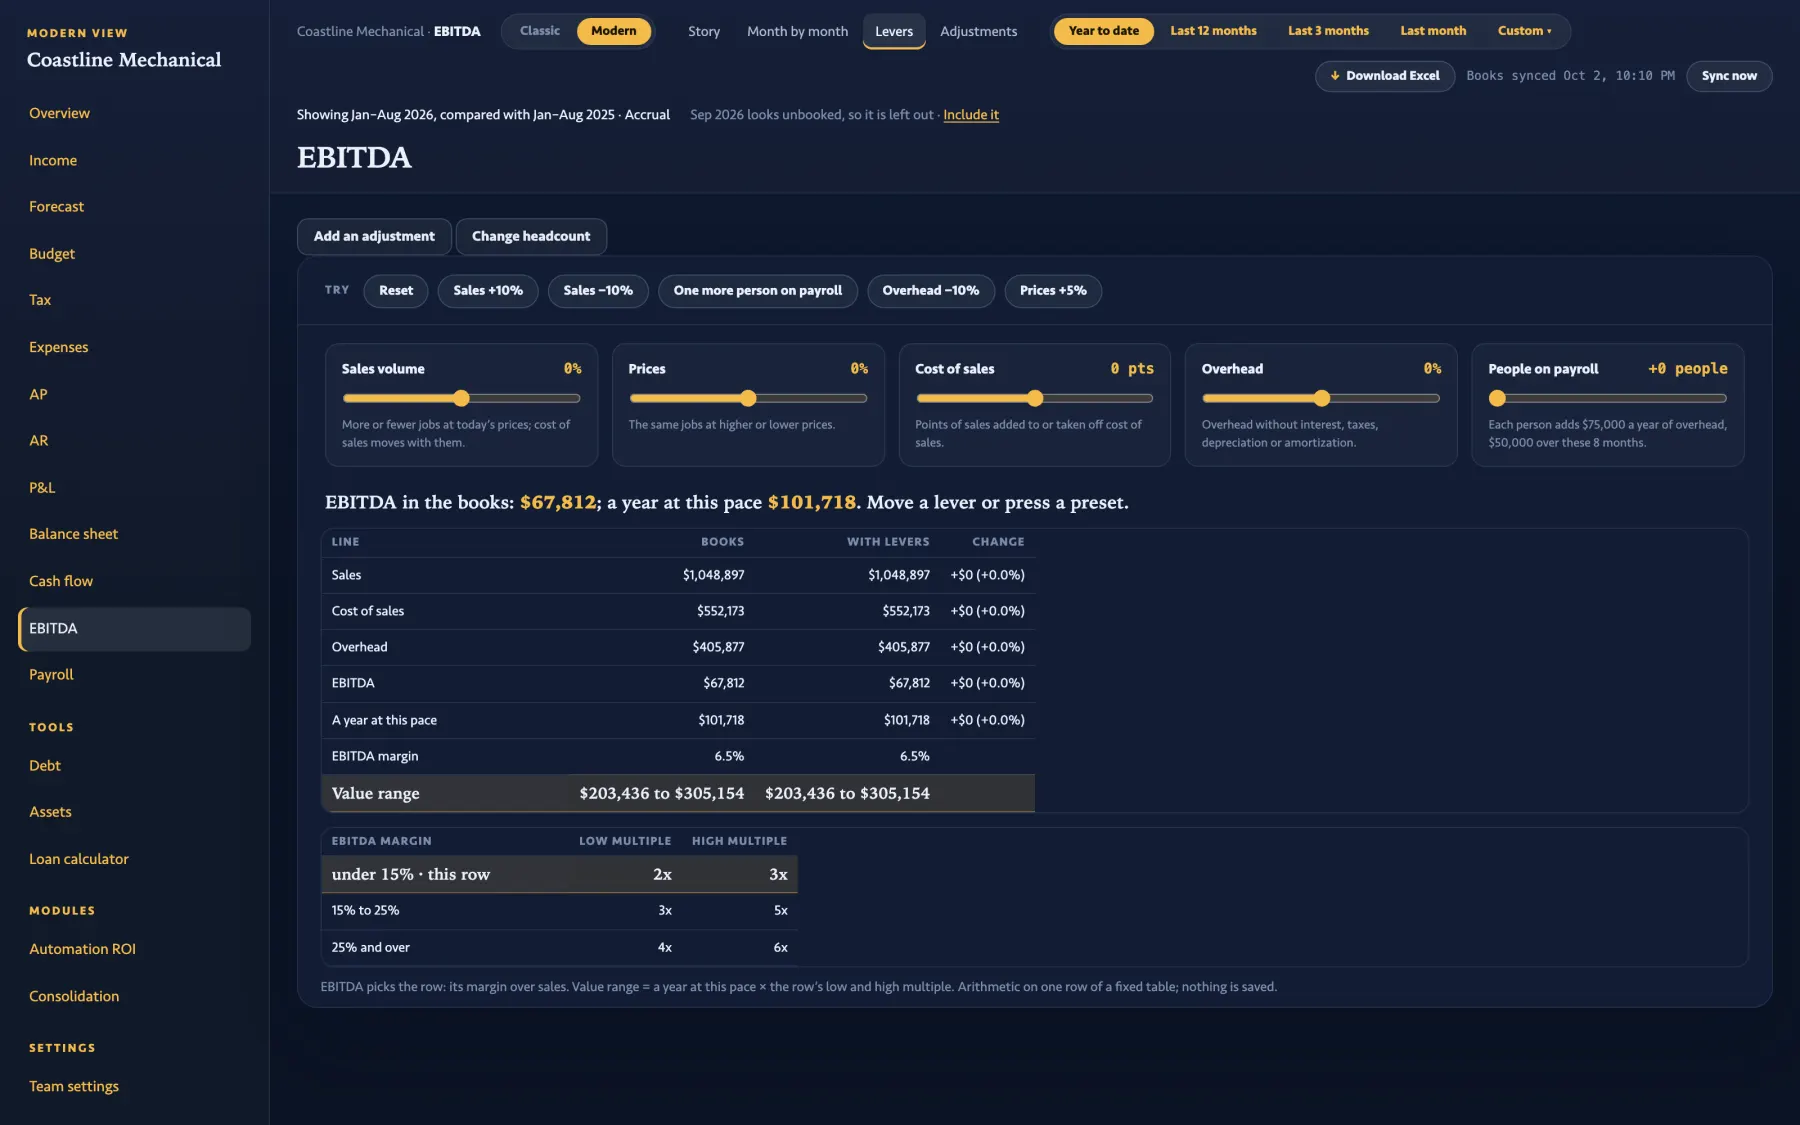
The EBITDA Levers page: five sliders, five presets, books against with-levers side by side, EBITDA $67,812 and the value range on a fixed multiple table.
CHAPTER 09

The plan, the statement, and what the business earns.

Jan–Aug net income is $26,588, +$7,539 (+39.6%) on the plan's $19,049: sales ran $164,530 over, costs $156,991 over. Ten budget chapters, a plan grid, and a year-end page that carries the gap forward in two fixed ways.

The P&L as a statement, month by month, and margins. EBITDA of $67,812 with levers, presets, and a value range read off one row of a fixed multiple table. Classic and Modern agree to the cent.

CHAPTER 10

The tools, told the same way.

Debt, assets, a loan calculator and an automation return are stories too: what is owed and when it is gone, book value by year, three loans side by side, and hours freed against tool cost.

Debt

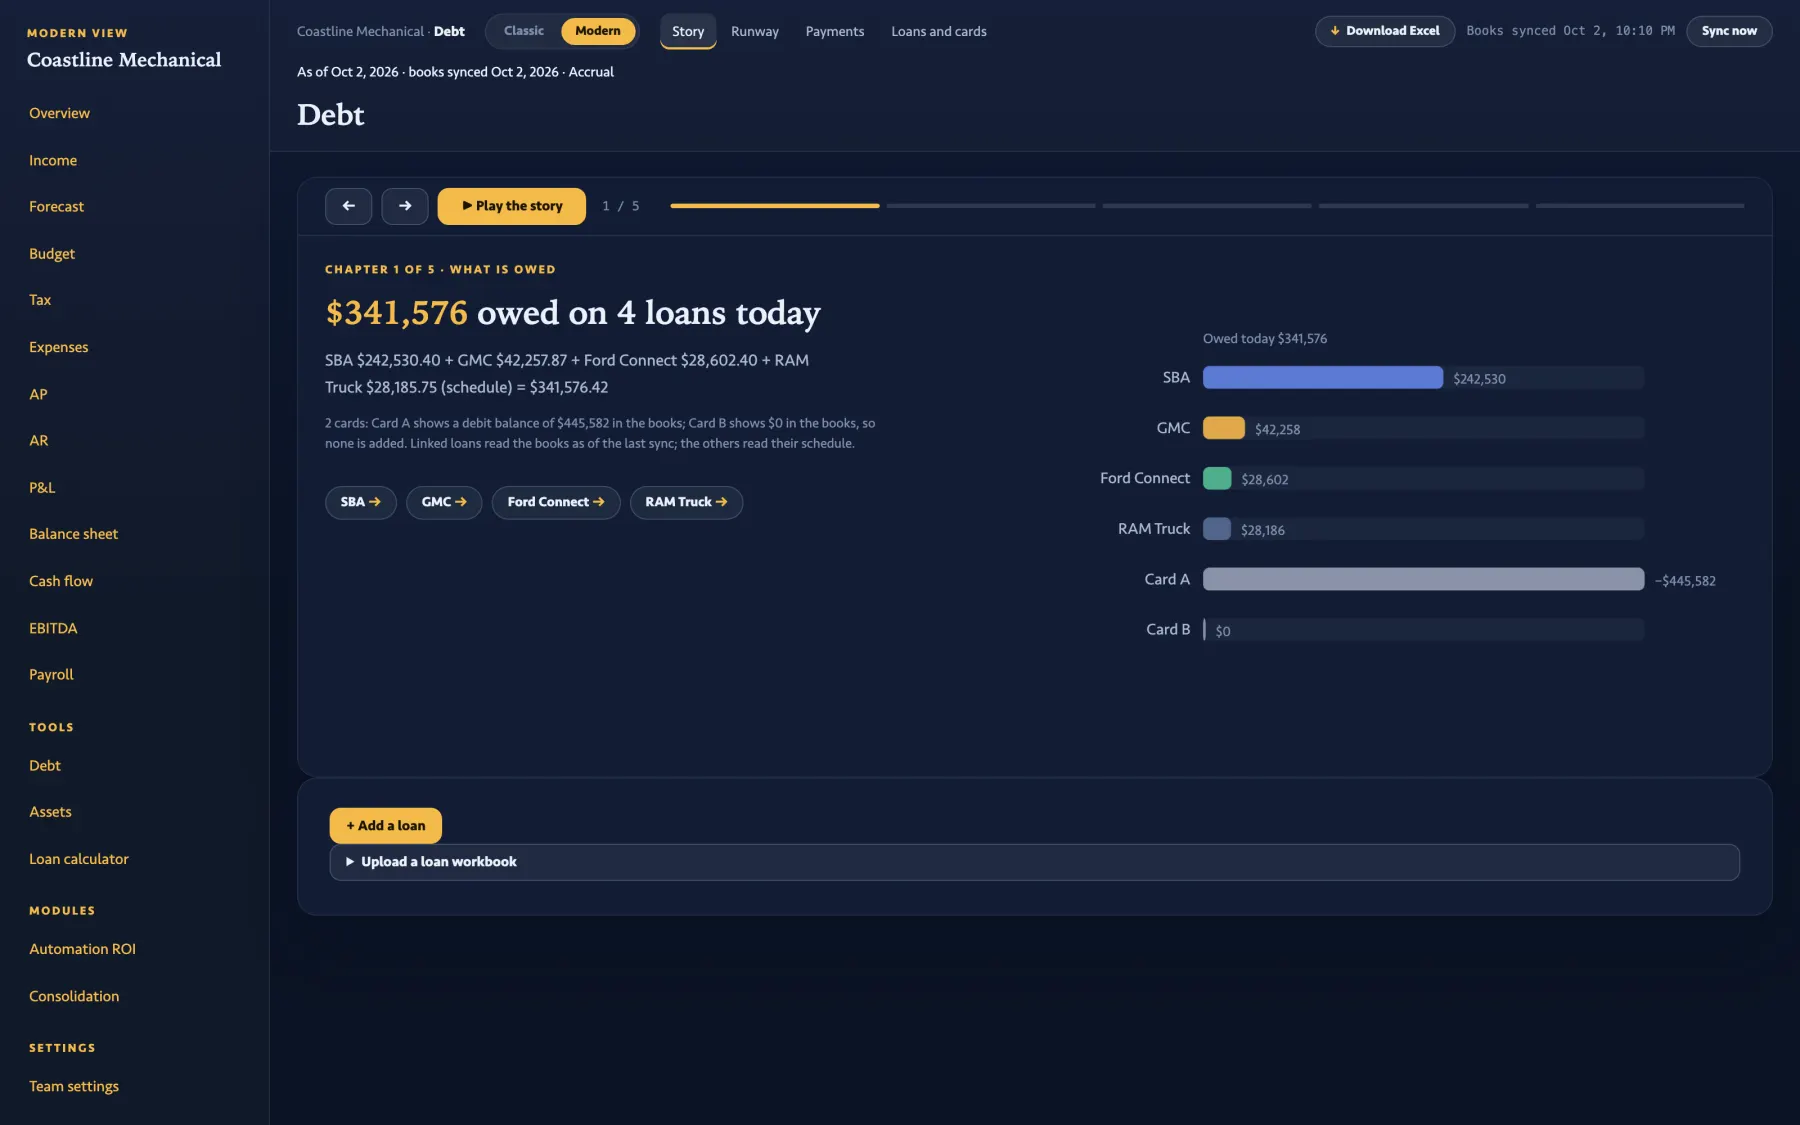
$341,576 on four loans and two cards. Runway, payments by month, and the books against the schedule.

The Debt Story: $341,576 owed across four loans, chapter 1 of 5.

Assets

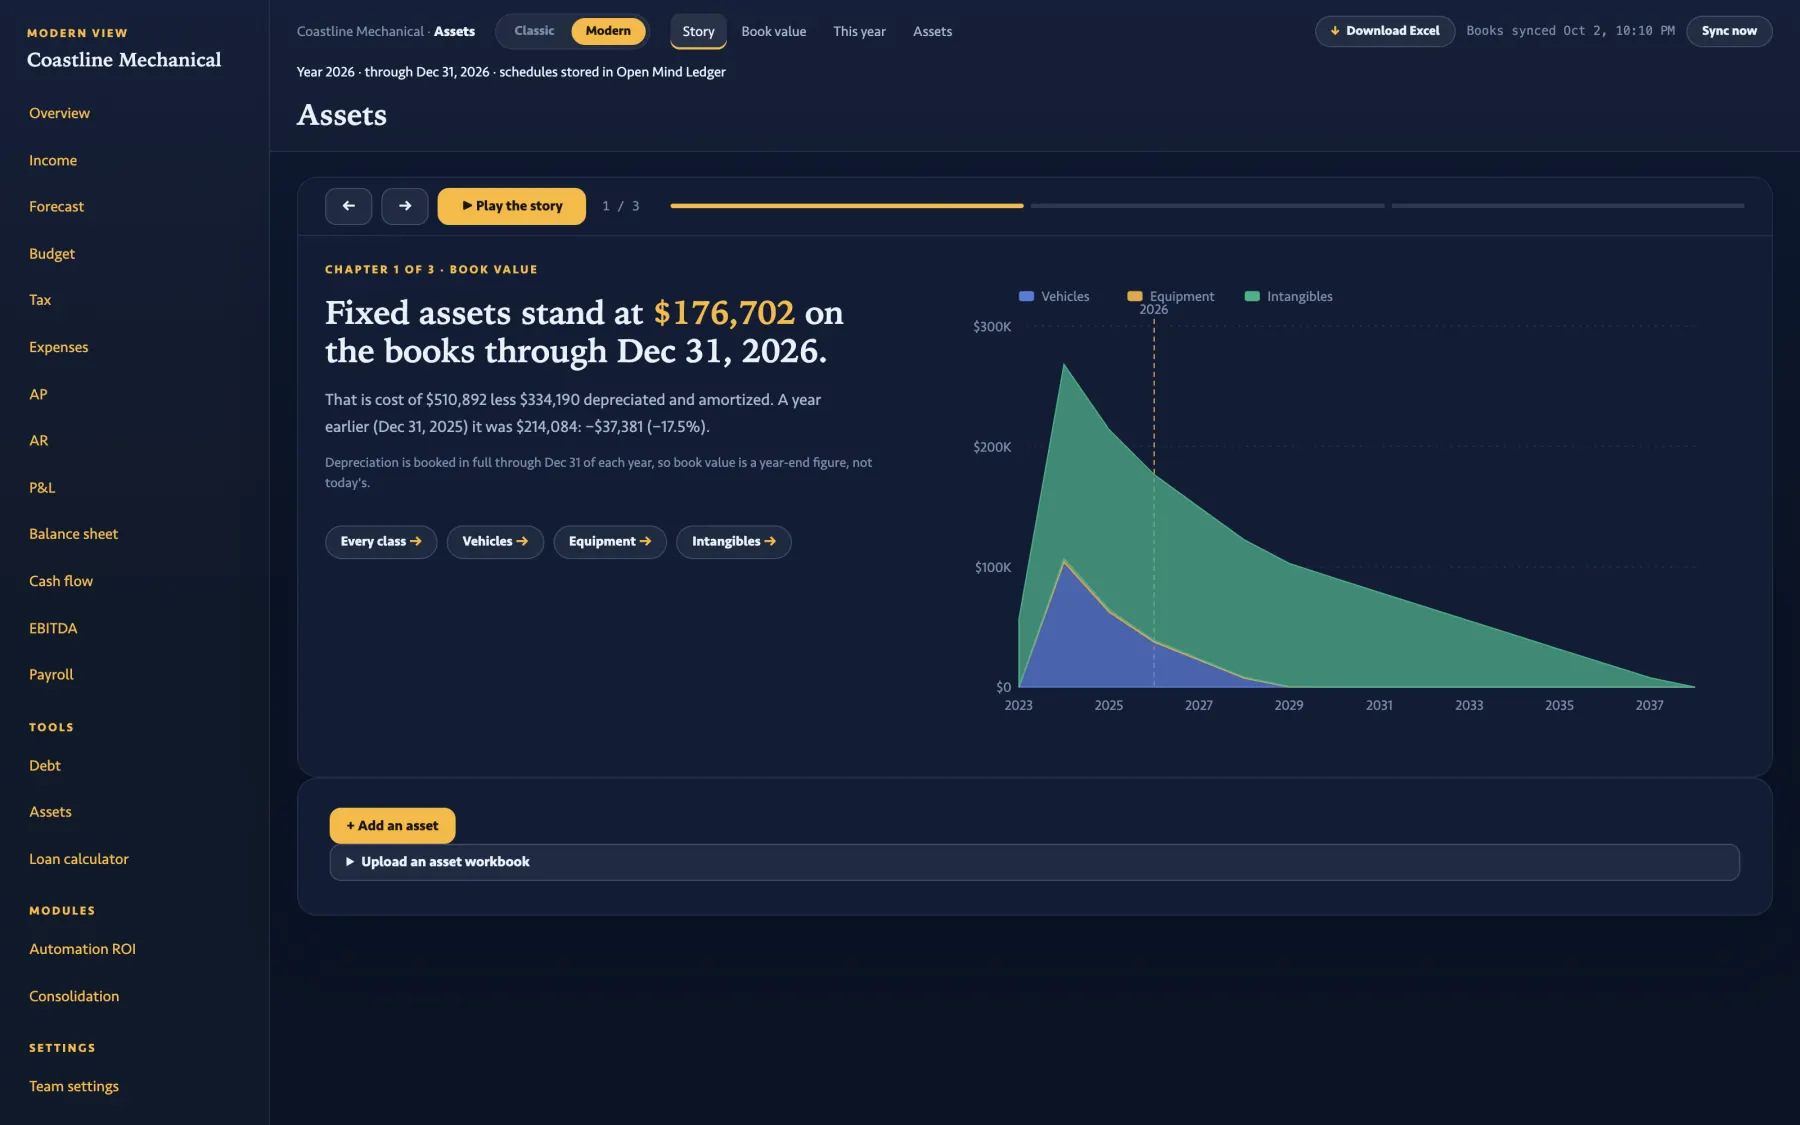
Fixed assets at $176,702 book value, bands by year, this year's depreciation.

The Assets Story: book value of fixed assets with the schedules stored in Open Mind Ledger.

Loan calculator

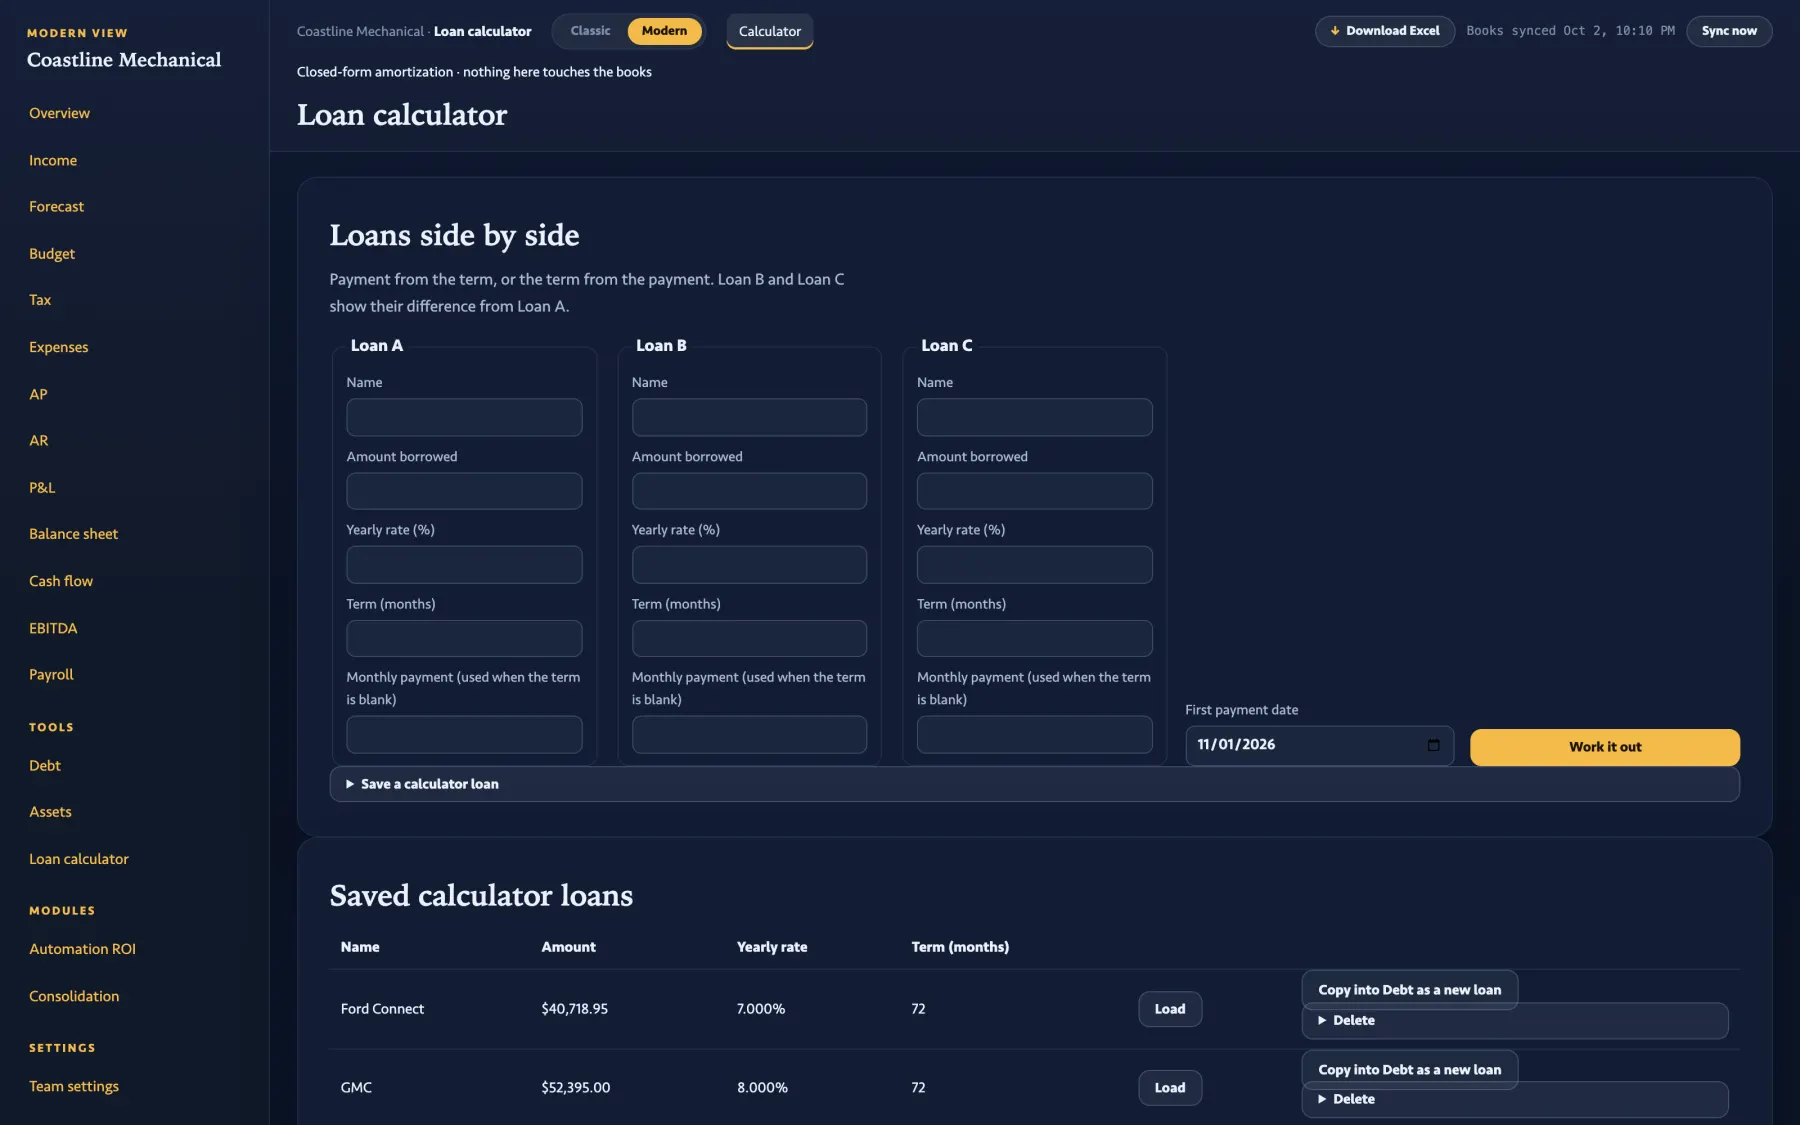
Loans A, B and C side by side, differences against A, closed-form math. Nothing is saved unless you say so.

The Loan calculator: three loans side by side with payment, total interest and the difference against loan A.

Automation ROI

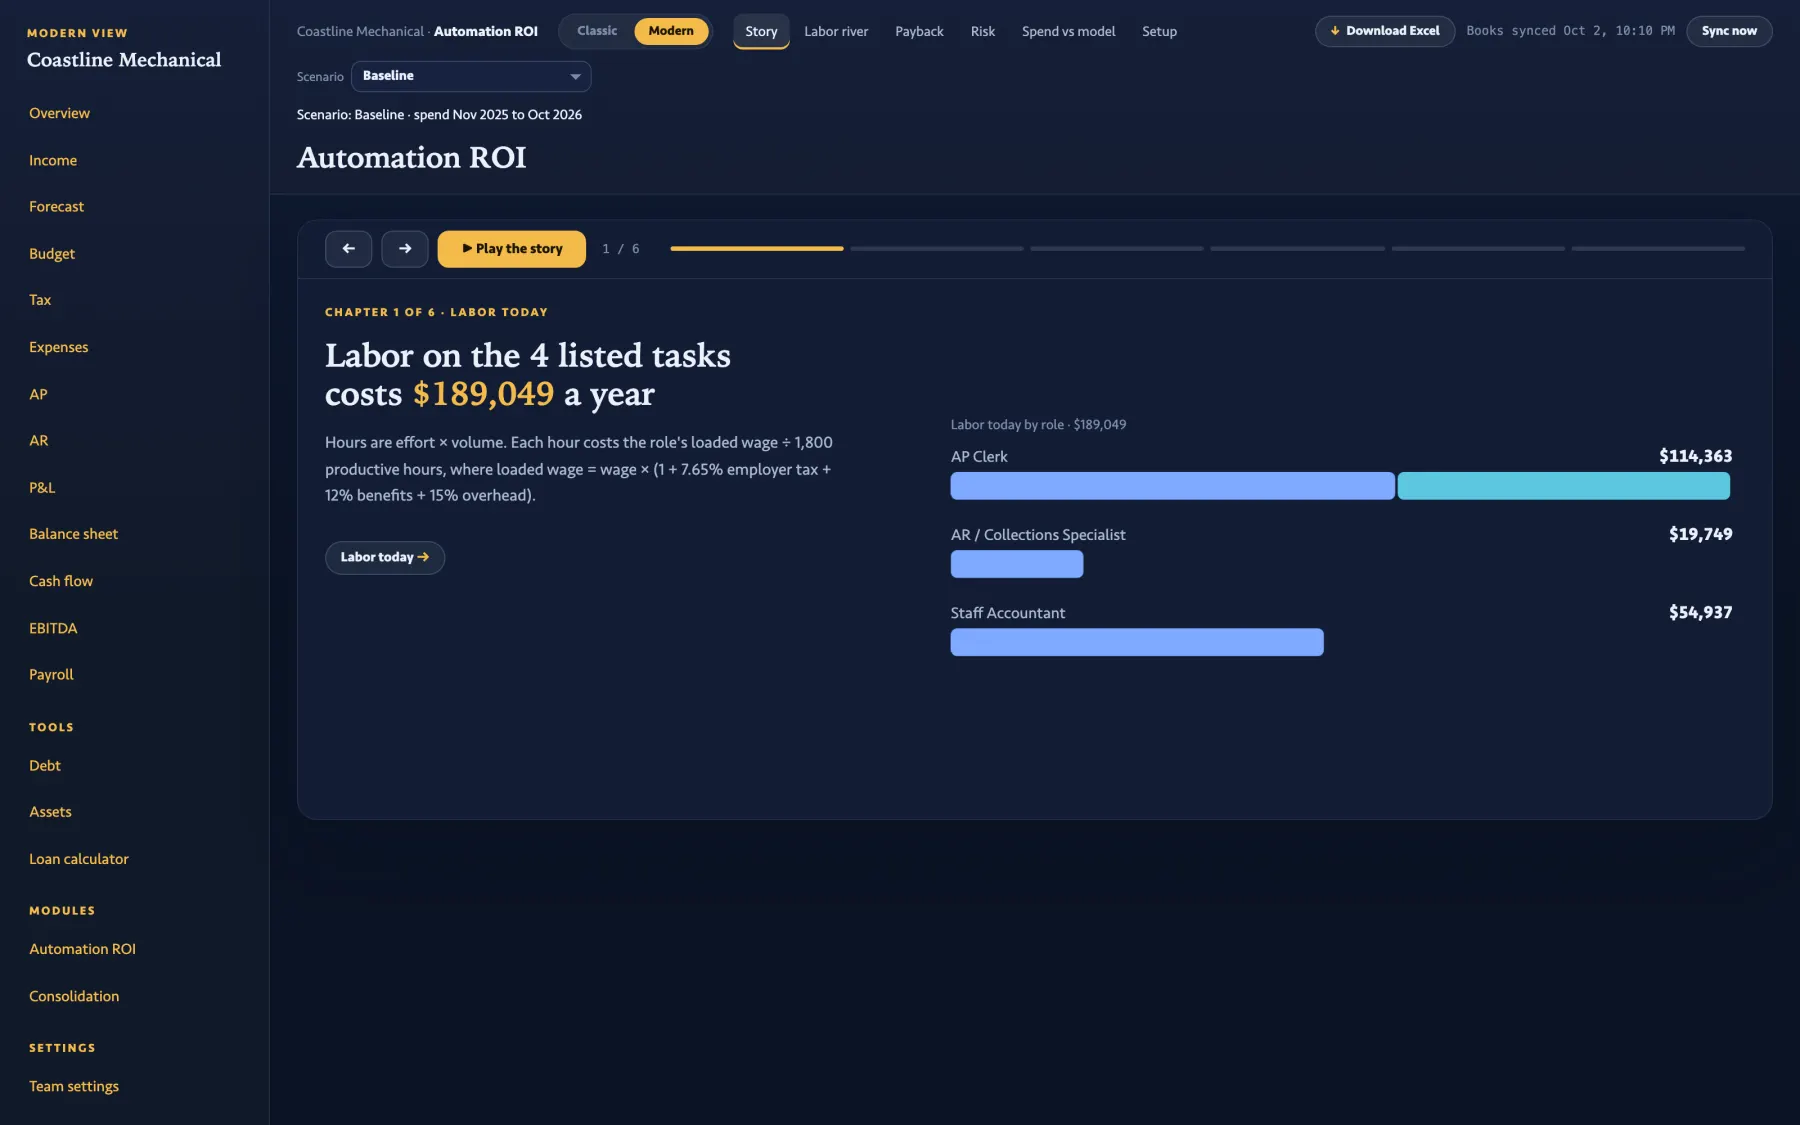
Hours per role, tool cost, payback month and a labor river. Three stored scenarios; $189,049 of labor in the baseline.

The Automation ROI Story for the Baseline scenario.
CHAPTER 11

When there is more than one company.

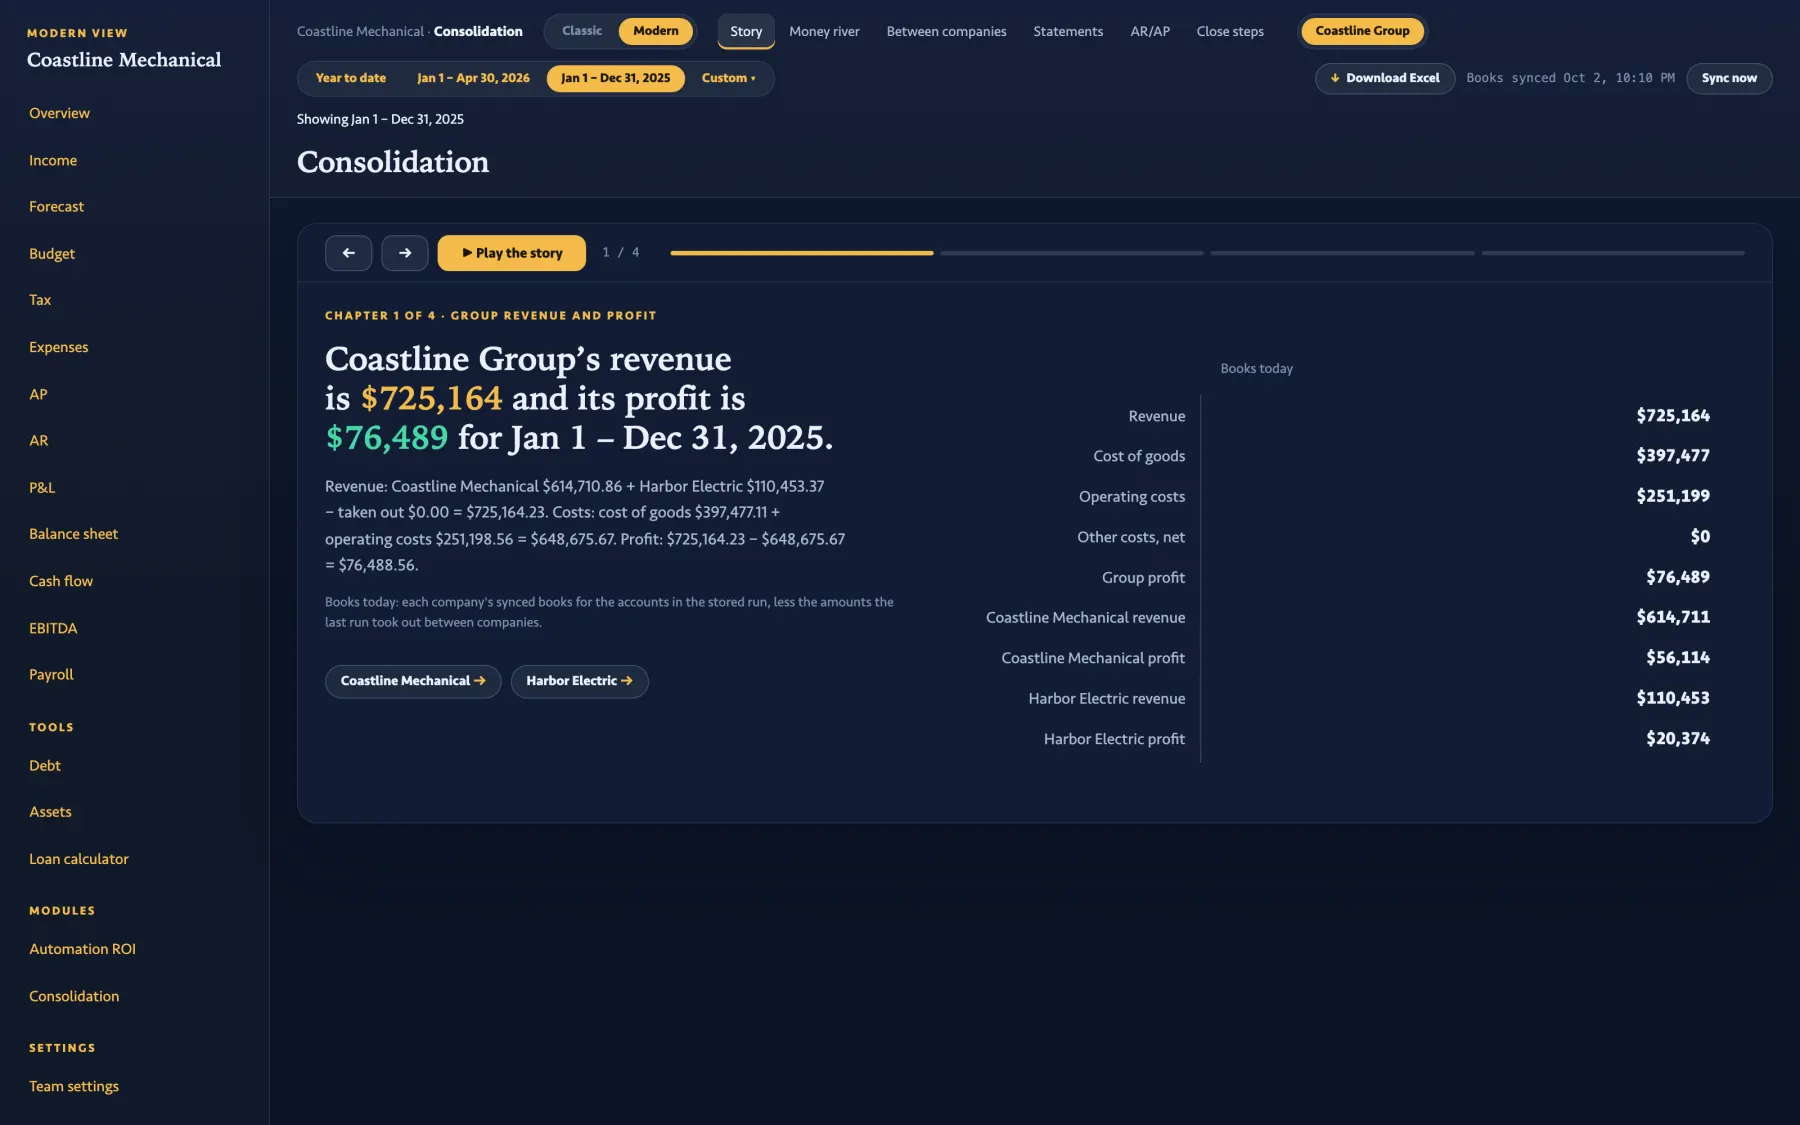
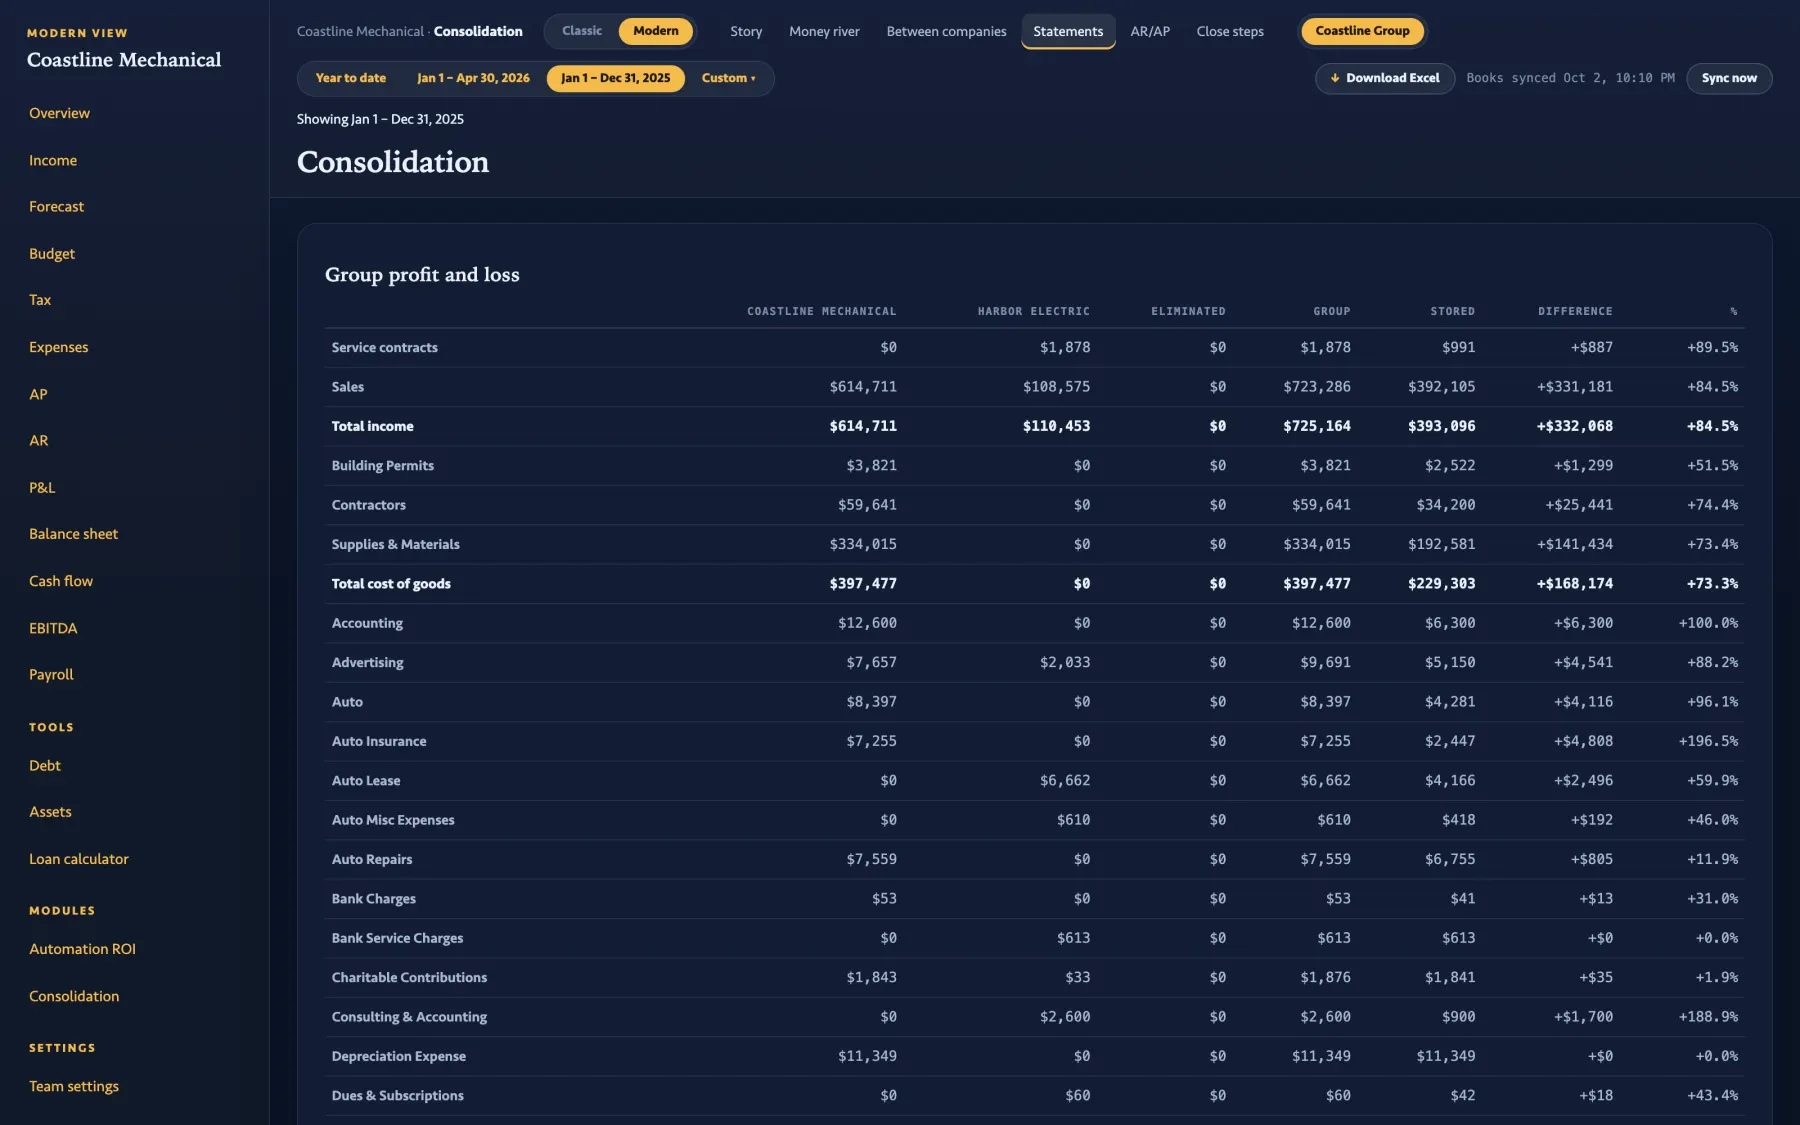
Coastline Group: Coastline Mechanical and Harbor Electric. Revenue $725,164, group profit $76,489 for 2025, with each company's share printed in the sentence and the stored run beside today's books, difference and all.

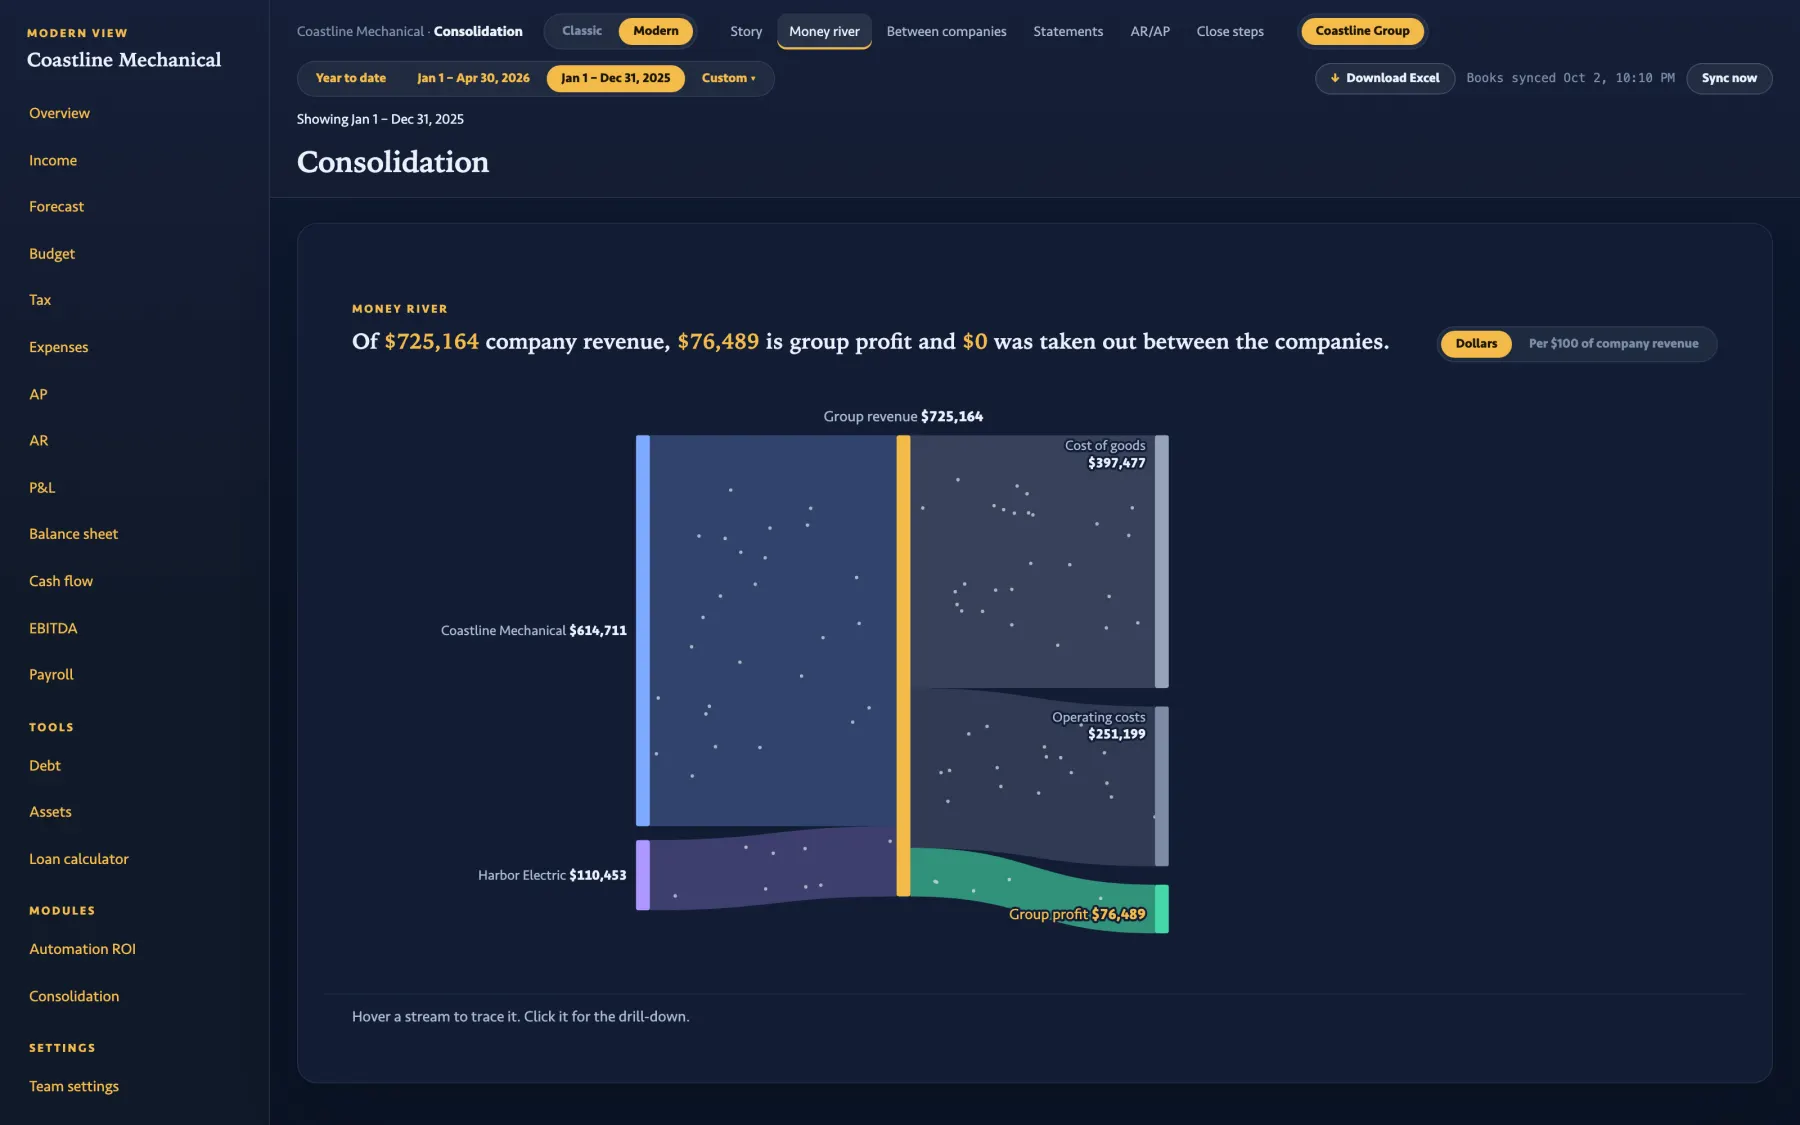
A money river by company, between-company pairs, statements, AR and AP across the group, and the close steps: run a period, lock it. Account mapping stays a person's choice, one row at a time.

The Consolidation Story for Coastline Group: revenue $725,164 and profit $76,489 for Jan 1 – Dec 31, 2025, with books today listed beside it.
The Consolidation Money river: the group's sales by company flowing to costs and profit.

Consolidation · Money river

The Consolidation Statements: company, eliminated, group, stored and difference columns.

Consolidation · Statements

Share it

The report is the page.

No PDF on Monday, no deck, no spreadsheet attached to an email. Invite the people who should read the story and they open the same page you see, with today's books in it.

  1. Connect the books

    QuickBooks Online or TransactionFlow. The app keeps its own synced copy and reads from that.

  2. Invite the readers

    The owner, a partner, the bookkeeper. Read-only logins with one access code per company. An accountant switches between clients from the rail.

  3. They read it

    Every chapter, every page, Excel on any section when someone wants the rows. What they see is what you see, with today's books in it.

The Overview Watch list as a client login sees it: 17 fixed lines, 6 over the line this month.

What a client login opens   The Overview watch list: 17 fixed lines, the figure beside each, 6 crossed this month.

What stays true on every page

Same books in. Same sentences out.

Written by fixed rules, not AIEach chapter has a rule that decides whether it shows and a template that fills in the numbers. Same books, same sentences, every time.no language model in the product
Every sentence shows its mathThe figures in a sentence open the rows under them. Nothing is stated that cannot be traced to a line in the books.drill on every chip
No extra QuickBooks callsPages read the synced copy. Opening a story, moving a lever or running a stress test costs nothing against your QuickBooks allowance.sync once a night
Cash or accrual, as the books areQuickBooks companies follow the company's method and can switch. TransactionFlow companies are cash basis and are shown that way.basis printed in the top bar
Classic is one click awayThe tile dashboards, explorers and statement pages are still there. Modern is the default; each person picks.Classic / Modern toggle
Excel everywhereEvery section and every detail window downloads as a workbook when somebody actually needs the rows.Download Excel
Pricing

One price, set by how many companies you connect.

Solo1–3 companies Starter1–5 companies Most popularGrowing6–15 companies Professional16–30 companies
Price
$29
per company / month
$125
per month
$300
per month
$450
per month
Modern view: story, cause map, rivers, forecast, taxIncludedIncludedIncludedIncluded
Classic dashboards: CEO, EBITDA, explorersIncludedIncludedIncludedIncluded
Budget moduleIncludedIncludedIncludedIncluded
Financial schedules: debt, assets, loan calculatorIncludedIncludedIncludedIncluded
Data Export API, priority supportIncludedIncludedIncludedIncluded
Multi-entity consolidationIncludedIncludedIncludedIncluded
Start trialStart trialStart trialStart trial
Business · 31–50 companies · $6,480 a year Enterprise · 50+ companies · Contact us
How the trial works
01Sign up, no card.

Email and a password. That's it.

02Connect one company.

QuickBooks Online or TransactionFlow. The first sync runs on its own.

03Read your own story.

Every page, Modern and Classic, for 5 days.

04Pick a plan, or don't.

No automatic charge when the trial ends.

Questions

The ones we get before the trial.

Is the story written by AI?

No. Fixed rules decide which chapters show and fill each sentence with numbers computed from your books. Same books, same sentences, every time, and every number opens the rows under it. There is no language model in the product.

Does it work with TransactionFlow books?

Yes. TransactionFlow companies get the same Modern view. TransactionFlow books are cash basis, so you see cash-basis figures, and the top bar says so.

Does it make extra calls to QuickBooks?

No. Every page reads the copy of the books the app syncs, so opening a story, moving a lever or running a stress test costs nothing extra.

What do the people I invite see?

The same pages you see, read-only, with today's books. There is no PDF to send; the page is the report. Anyone can download Excel for a section when they need the rows.

How does the free trial work?

Full access to every module for 5 days with one company, including multi-entity consolidation. No credit card. After the trial, pick the plan that matches your company count.

Can I pay monthly, and change plans later?

Yes. Monthly with no long-term commitment; annual billing saves 10% on any plan. Upgrade any time to add companies or features; downgrade at your next billing cycle.

Is there a data export API?

Yes, on every plan: read-only, authenticated access to your team's alerts, KPIs, rules and recent transactions. Connect any business tool that can make an authenticated request. Your data stays yours.

Read your own story this week.

Start free trial 5 days · no credit card · QuickBooks Online or TransactionFlow